Can Image Quality Metrics Replace Human Raters? 23 NR-IQA Metrics Against Blind Votes

We scored two blind pairwise tests with 23 no-reference image quality metrics. The leaders of one set failed on the other, and inside a single matchup the metrics lost the signal raters kept.
Evaluation period: blind test October 27, 2026; ladder v3 votes from four model sessions on the anchors built in August 2026
Confidence: directional, no metric cleared the bar for replacing raters
Corpus: anchors_v3, 48 scenes and 1,152 pairs; blind test, 24 tasks and 72 pairs
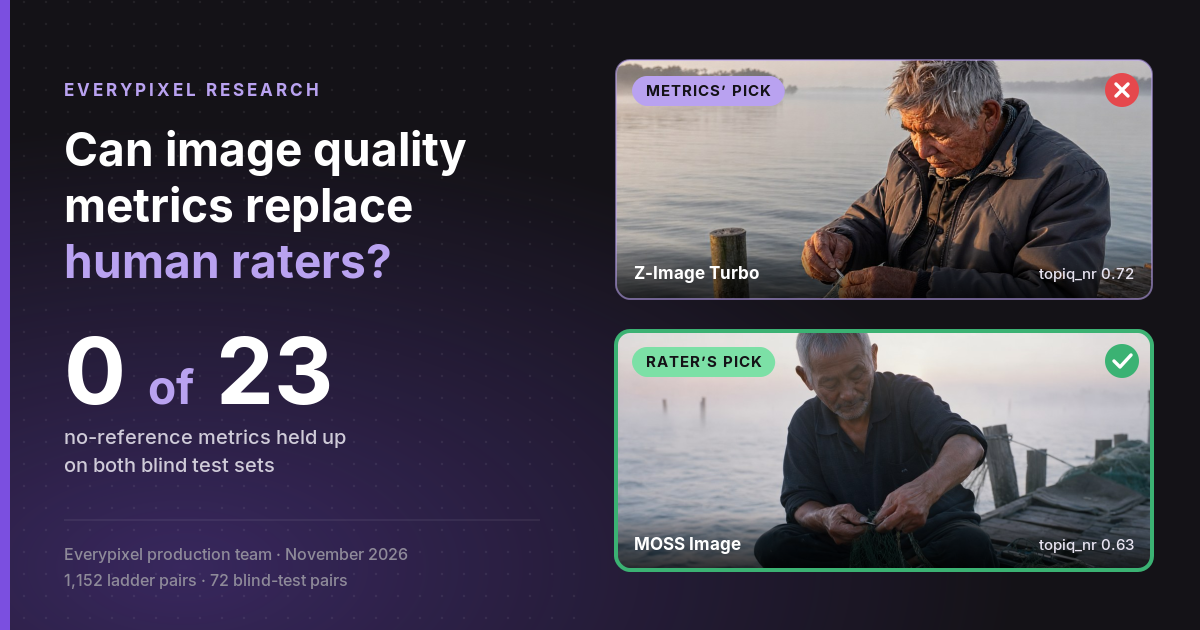
No. In our November 2026 analysis, none of 23 no-reference metrics held up on both blind tests. topiq_nr led 1,152 ladder pairs at ρ +0.37 [95% CI: 0.28–0.46], then scored −0.25 [−0.45 to −0.04] on 72 blind-test pairs. Inside one model-anchor matchup, it fell to about zero, while raters still agreed with each other (Everypixel production team, November 2026).
Can image quality metrics replace human raters in AI image evaluation? The appeal is obvious: a metric scores an image in seconds and never gets tired, while a blind pairwise panel takes people and days.
We put 23 no-reference image quality assessment (NR-IQA) metrics against votes we already had, on two sets that differ in models, content and panel size. This is the second time we have asked the question. In August 2026 we published a test of LLM judges on upscaled images, and the AI judge did not clear the bar either.
How we tested NR-IQA metrics against human votes
- Ladder v3: 48 photographic scenes across 8 categories. Four models with three generations each face two anchors, which gives 288 pairs per model and 1,152 pairs in total, with three raters per pair. We use the realism scale; the published ladder studies name this scale realism or believability.
- Blind test: 24 tasks, three models, 72 pairs, one rater. The tasks include text in images, infographics, illustration and anime as well as photography. Images were shown downscaled to Z-Image size (1280×720 or 864×1152) and scored at that size, so the metrics saw what the rater saw.
- Metrics: local scores for every image in both sets. qinsight has partial coverage, 799 ladder pairs and 39 blind-test pairs.
- Correlation: Spearman's ρ between the human vote and the difference between the two images' scores.
- Accuracy: the share of pairs where the metric picked the same winner as people. Pairs people tied are excluded. When a metric gives both images the same score, the pair counts as half a hit, which matters for UniPercept, whose scores are coarse.
- Intervals: 95% bootstrap over scenes on the ladder and over tasks on the blind test.
Three limits apply to everything below. The blind test rests on one rater and 72 pairs, so its intervals are wide. The sets use different targets: realism on the ladder, the sum of all scales from −3 to +3 on the blind test, which includes prompt adherence and text accuracy that a no-reference metric cannot see by design. Finally, the blind test has three models, so its effective sample at the model level is small however many pairs it holds.
NR-IQA metrics vs human votes: results
| Metric | Ladder ρ | Ladder accuracy | Ladder rank | Blind ρ | Blind accuracy | Blind rank |
|---|---|---|---|---|---|---|
| topiq_nr | +0.37 [+0.28; +0.46] | 0.66 | 1 | −0.25 [−0.45; −0.04] | 0.46 | 16 |
| maniqa | +0.33 [+0.24; +0.42] | 0.64 | 2 | −0.45 [−0.64; −0.20] | 0.31 | 22 |
| clipiqa | +0.29 [+0.18; +0.40] | 0.62 | 3 | −0.34 [−0.53; −0.15] | 0.29 | 21 |
| qualiclip_plus | +0.25 [+0.14; +0.36] | 0.61 | 4 | −0.19 [−0.48; +0.12] | 0.43 | 12 |
| clipiqa_plus | +0.24 [+0.11; +0.35] | 0.59 | 5 | −0.31 [−0.48; −0.12] | 0.37 | 18 |
| liqe | +0.23 [+0.14; +0.33] | 0.60 | 6 | −0.49 [−0.68; −0.26] | 0.29 | 23 |
| reliqs | +0.23 [+0.13; +0.32] | 0.61 | 7 | −0.01 [−0.30; +0.29] | 0.54 | 7 |
| musiq | +0.22 [+0.12; +0.32] | 0.59 | 8 | −0.30 [−0.56; +0.03] | 0.40 | 17 |
| uiqa | +0.20 [+0.11; +0.29] | 0.59 | 9 | −0.06 [−0.35; +0.21] | 0.46 | 9 |
| qrealign_iqa | +0.12 [+0.02; +0.23] | 0.57 | 10 | −0.14 [−0.42; +0.16] | 0.49 | 11 |
| qualiclip | +0.11 [+0.01; +0.21] | 0.56 | 11 | −0.21 [−0.43; +0.03] | 0.43 | 13 |
| unipercept_iaa | +0.10 [+0.02; +0.18] | 0.54 | 12 | +0.22 [−0.09; +0.50] | 0.65 | 3 |
| fgresq | +0.07 [−0.03; +0.17] | 0.53 | 13 | −0.23 [−0.46; +0.02] | 0.43 | 14 |
| qinsight | +0.01 [−0.10; +0.12] | 0.51 | 14 | −0.11 [−0.54; +0.33] | 0.53 | 10 |
| hpsv3 | +0.01 [−0.09; +0.10] | 0.50 | 15 | +0.01 [−0.32; +0.33] | 0.52 | 6 |
| unipercept_ista | −0.00 [−0.09; +0.09] | 0.50 | 16 | +0.16 [−0.12; +0.43] | 0.63 | 4 |
| unipercept_iqa | −0.01 [−0.12; +0.10] | 0.50 | 17 | +0.25 [−0.00; +0.47] | 0.61 | 1 |
| laion_aes | −0.04 [−0.15; +0.07] | 0.50 | 18 | +0.24 [+0.05; +0.43] | 0.63 | 2 |
| deqa | −0.05 [−0.18; +0.08] | 0.48 | 19 | −0.24 [−0.50; +0.05] | 0.41 | 15 |
| qrealign_iqa448 | −0.08 [−0.19; +0.03] | 0.47 | 20 | −0.02 [−0.30; +0.25] | 0.51 | 8 |
| qsit | −0.14 [−0.24; −0.03] | 0.46 | 21 | +0.11 [−0.20; +0.43] | 0.58 | 5 |
| qalign | −0.16 [−0.28; −0.04] | 0.44 | 22 | −0.33 [−0.53; −0.09] | 0.35 | 20 |
| rali | −0.16 [−0.27; −0.05] | 0.44 | 23 | −0.31 [−0.54; −0.06] | 0.37 | 19 |
The table is sorted by ladder ρ. The two columns of ranks barely overlap at the top, and the leaders of one set sit near the bottom of the other.
Findings
Do the same metrics lead on both test sets?
Finding 1
No NR-IQA metric in our test transferred between sets: of 23 metrics, none has a 95% interval above zero on both the ladder and the blind test (Everypixel production team, November 2026).
On the ladder, topiq_nr leads with ρ +0.37 [0.28–0.46] and accuracy 0.66, followed by maniqa at +0.33 and 0.64 and clipiqa at +0.30 and 0.62. On the blind test, unipercept_iqa leads with +0.25 [0.00–0.47] and 0.61, followed by laion_aes at +0.25 and 0.63 and unipercept_iaa at +0.22 and 0.65.
The closest thing to a survivor is unipercept_iaa, one of two metrics with a positive ρ on both sets. Its ladder accuracy is 0.54 [0.50–0.58], which is a coin flip for practical purposes. Ranks across all 23 metrics correlate at −0.40 between the sets, so a good ladder score did not predict a good blind-test score.
Do the ladder leaders really flip sign on the blind test?
Finding 2
The three ladder leaders score below zero on the blind test: topiq_nr −0.25, clipiqa −0.34, maniqa −0.45. On the realism scale alone, the same as the ladder's, topiq_nr and maniqa weaken to −0.13 and −0.17 with intervals that include zero (Everypixel production team, November 2026).
The direction of the failure depends on how you read it. On the combined score, maniqa and clipiqa pick the rater's loser often enough to fall below chance: accuracy 0.31 [0.19–0.43] and 0.29 [0.19–0.41]. topiq_nr, at 0.46 [0.32–0.59], is a coin flip rather than a reversal.
Restricted to realism, the fair comparison with the ladder, only clipiqa stays clearly negative at −0.32 [−0.57 to −0.02], on 45 pairs. So the safe statement is that the ladder leaders do not transfer. "They reverse" holds for maniqa and clipiqa on the combined and aesthetic scales, and it does not hold for every metric on every scale. The same test run scale by scale (realism, aesthetics, prompt adherence) gives the same outcome: no metric has an interval above zero on both sets.
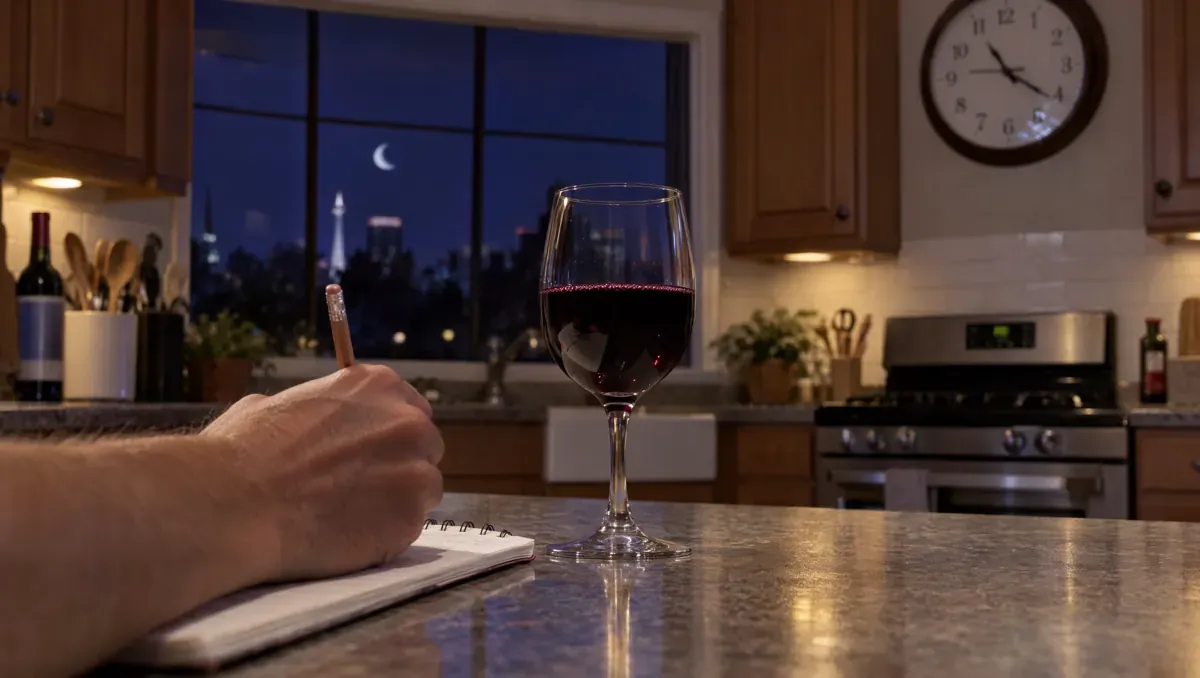
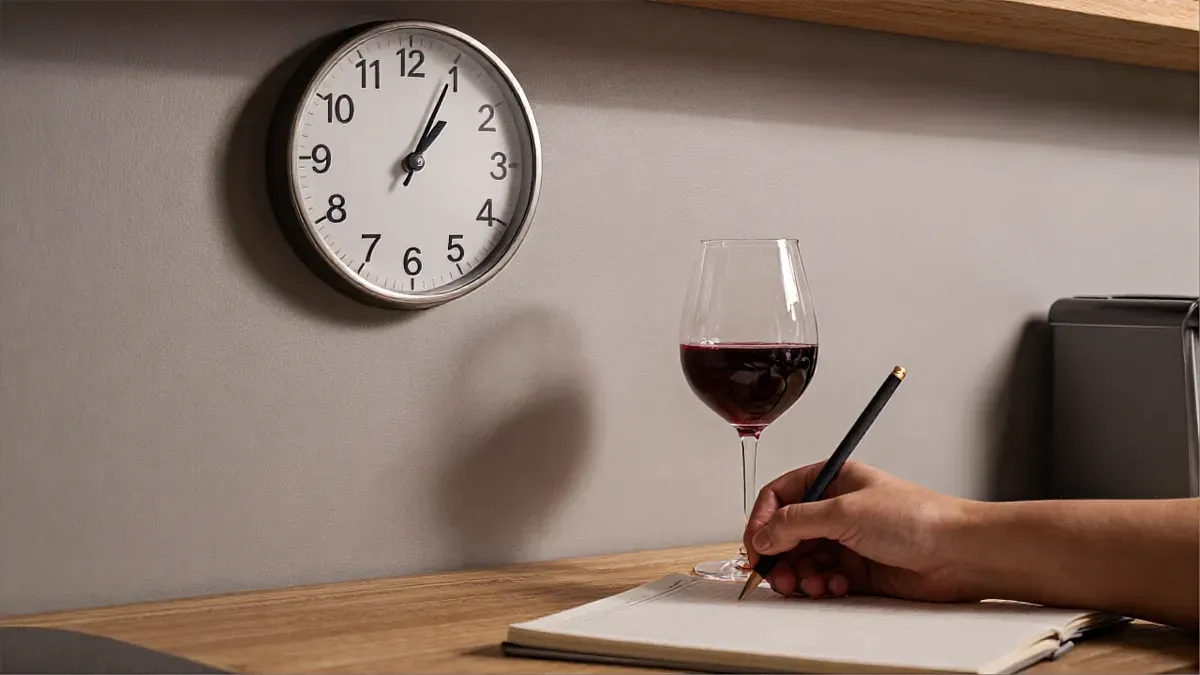
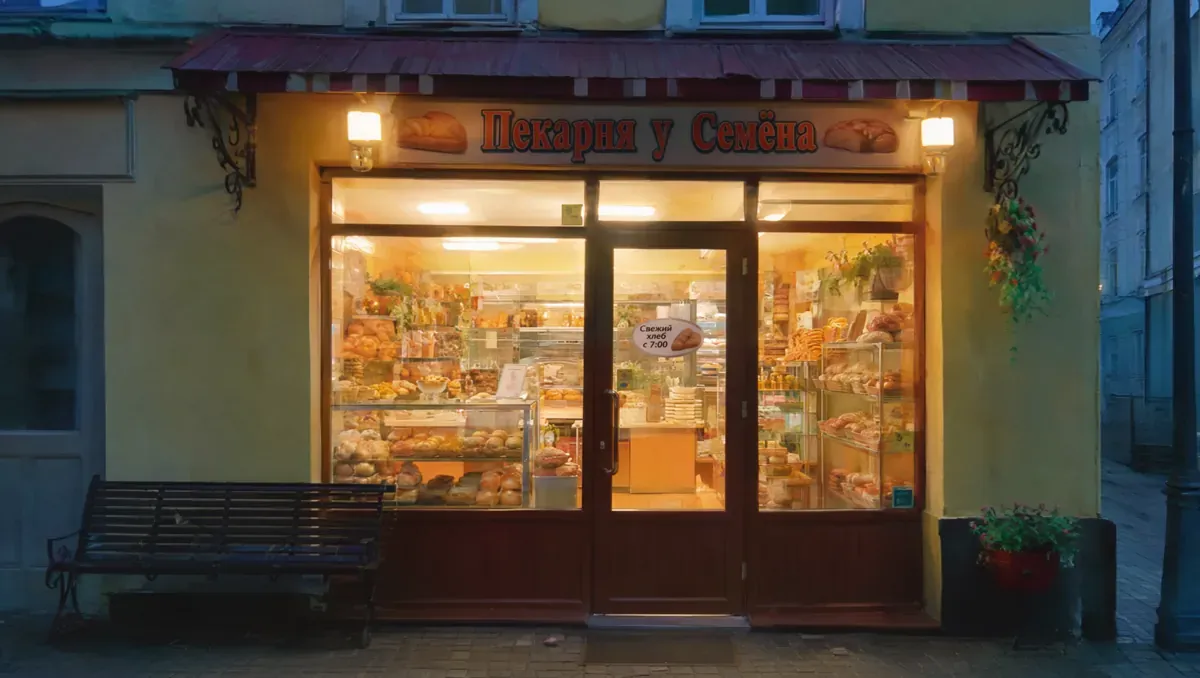
Removing the six text tasks does not rescue the leaders: clipiqa is −0.40 and maniqa −0.28 on the remaining 54 pairs. Text explains part of the gap, as the bakery pair below shows, but not all of it. This kitchen scene has no text task, and it splits the leaders of the two sets cleanly.
MOSS Image
Z-Image Turbo
task_2_4Do metrics see anything inside a single matchup?
Finding 3
Inside one model-and-anchor matchup on the ladder, all 23 metrics fall to ρ between −0.07 and +0.07, and no interval excludes zero. On 576 published ladder pairs, one rater predicts the other two at ρ 0.24 [0.16–0.30] in the same condition, while topiq_nr reaches 0.01 (Everypixel production team, November 2026).
This is the strongest evidence in the study, because it answers the obvious defense that human votes are simply noisy. They are noisy. Agreement is low on believability, with AC1 at 0.13 for Seedream 5 Pro and 0.08 for GPT Image 2.5 Sunburst against GPT Image 2, so the human findings themselves are directional.
Across all pairs, though, one rater predicts the other two at ρ 0.31 [0.22–0.38], and topiq_nr reaches 0.35 on the same pairs. Accuracy is close too, 0.70 [0.64–0.76] against 0.66. If that were the whole story, a metric would look like a passable extra rater.
The gap opens once the pair type is held fixed. Raters keep most of their signal, and the metrics lose nearly all of it. Whatever people agree on inside one matchup, these metrics do not measure it.
The human figures use GPT Image 2.5 Sunburst and Seedream 5 Pro only, the two ladder models whose published votes we could match to individual images, and the 574 of 576 pairs with three complete ratings. The metric is compared with a three-rater mean and each rater with a two-rater mean, so the comparison slightly favors the metric. The same pattern shows on the full ladder, where topiq_nr's within-matchup ρ is −0.01.
How much of a metric's accuracy is just knowing the group?
Finding 4
A rule that never looks at an image matches or beats the best metric. On 576 published ladder pairs, picking each matchup's usual winner scores 0.67 [0.61–0.73] against 0.66 for topiq_nr. On the blind test, always ranking MOSS Image over Krea 2 Turbo over Z-Image Turbo scores 0.80 [0.67–0.91] against 0.65 for the best metric (Everypixel production team, November 2026).
The rule is written in hindsight, so it is a yardstick and not a usable predictor. The yardstick still shows where the metric's score comes from. On the blind test, replacing each image's score with the metric's average for that model pair gives |ρ| of 0.50 or more for most metrics, up to 0.53, which is stronger than any metric's real score. Hold the model pair fixed and ρ averages −0.09 across metrics and never rises above +0.10.
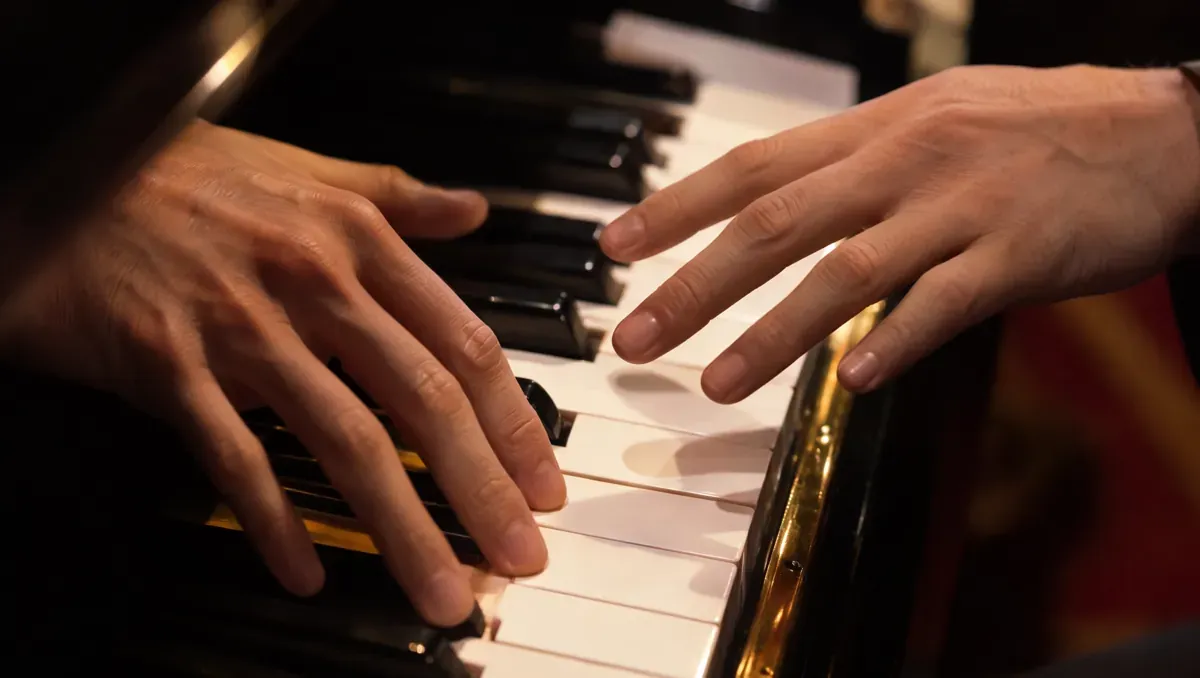
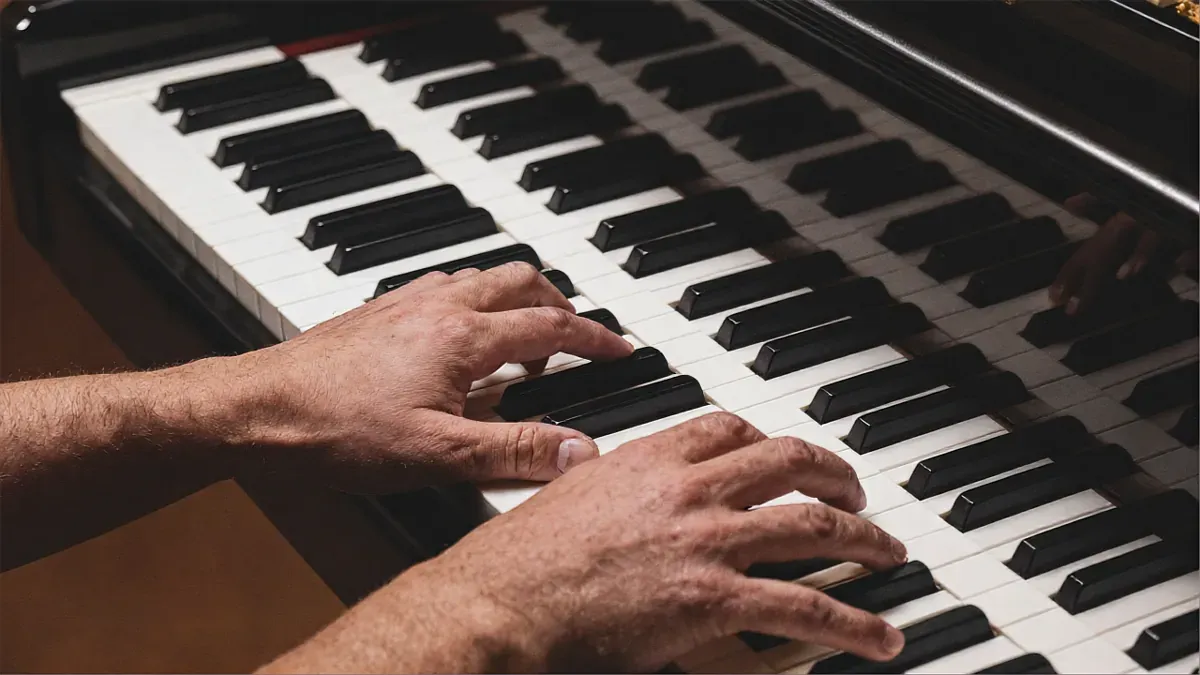
The rule is crude, and it misses 13 of the 65 decided pairs. In the piano scene below it picks MOSS Image, the rater chose Z-Image Turbo on all three scales, and four of the six leading metrics got it right.
MOSS Image
Z-Image Turbo
task_5_2Our hypothesis is that these metrics respond to a model's rendering signature more than to the qualities raters compare. The data shows the group effect and does not identify its cause.
Do the leaders at least recover the ladder's own order?
Finding 5
All three ladder leaders rank the floor anchor, FLUX.2 Klein 9B, above the mid anchor, Qwen Image 2, the reverse of the order raters established. topiq_nr averages 0.55 on the floor and 0.44 on mid, maniqa 0.40 and 0.32, clipiqa 0.65 and 0.55 (Everypixel production team, November 2026).
On pairs of anchors alone, topiq_nr reaches ρ +0.11 [−0.03 to 0.25], with an interval that includes zero. A metric that wins the overall ladder table without recovering the ladder is reading something other than the scale we built. Part of the headline ρ likely comes from one anchor's unusually low scores, which is the same group effect as Finding 4.
Are the blind-test leaders real?
Finding 6
The blind-test leaders cannot be told from a lucky draw. With votes randomized, the best of 22 fully scored metrics still reaches a median ρ of 0.20 on 72 pairs, and it exceeds 0.33 only 5% of the time, so a top score near 0.25 is what chance alone tends to produce (Everypixel production team, November 2026).
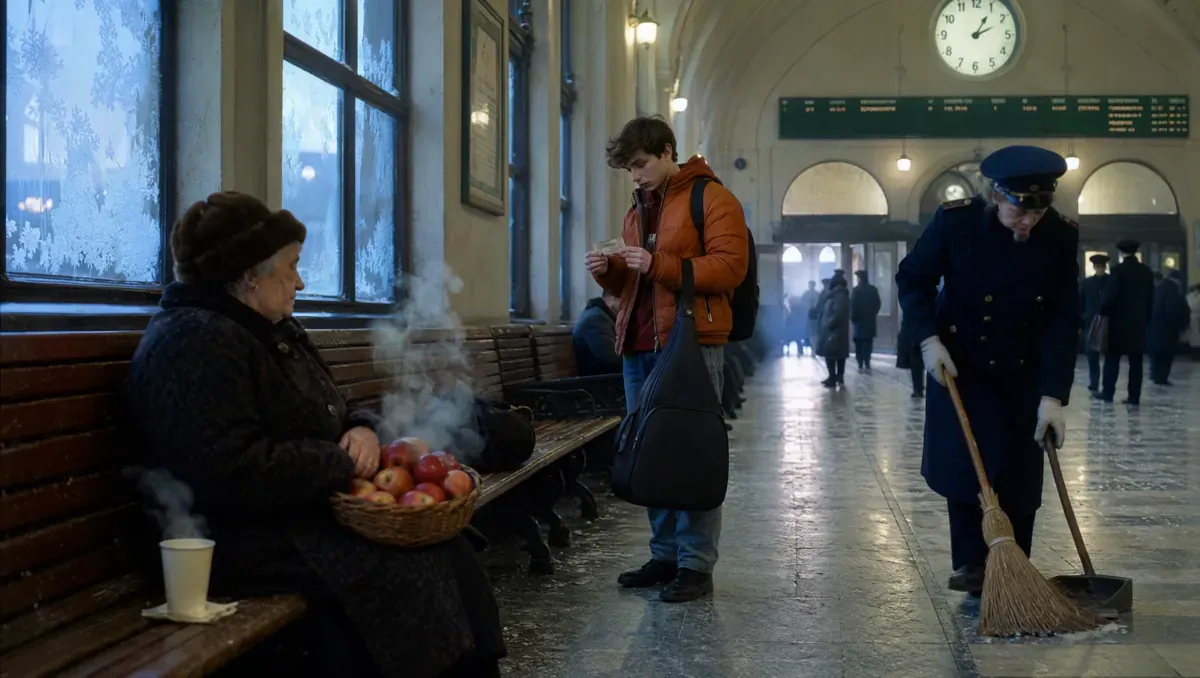
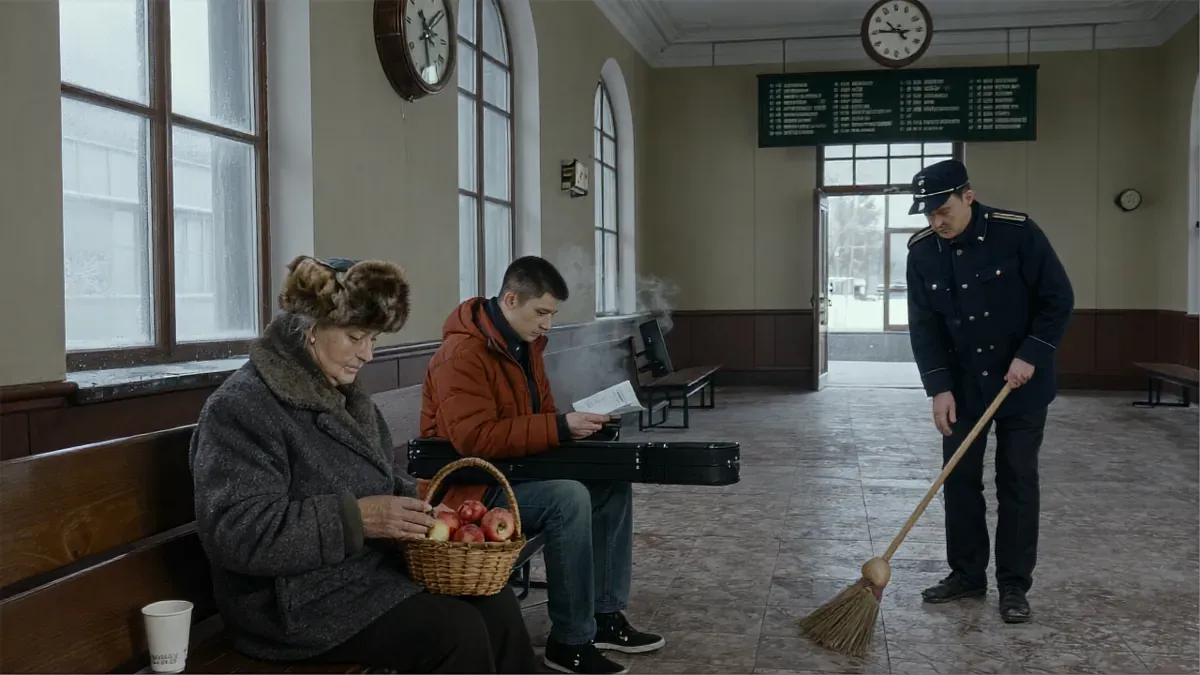
The negative results are harder to explain away. maniqa and liqe fall lower than the randomized worst case does in nearly all runs. That points to a real misalignment on this set, though with three models it may be a single fact about Z-Image Turbo, which the rater ranked last and nine of the 23 metrics score highest on average, among them all three ladder leaders.
MOSS Image
Z-Image Turbo
task_7_4Size alone moves the numbers as well. Scored at native resolution instead of the size the rater saw, topiq_nr goes from −0.25 to −0.51, and reliqs from −0.01 to −0.37. Anyone using these metrics needs to fix the input size first.
Where the metrics failed: three pairs
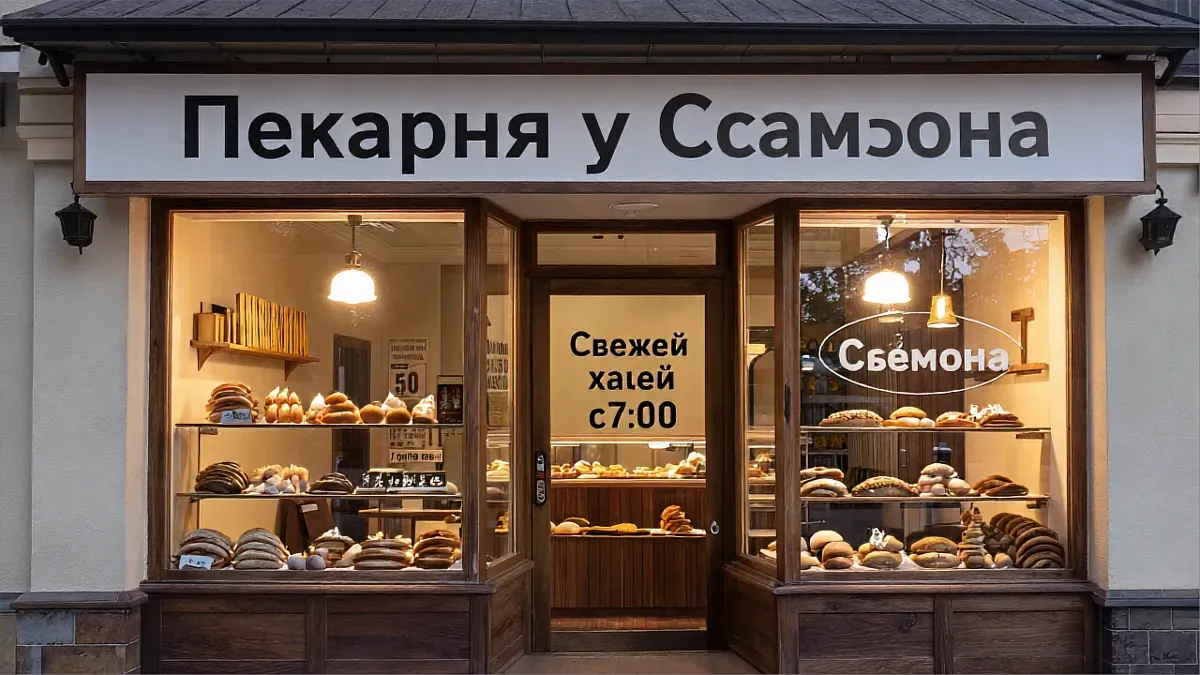
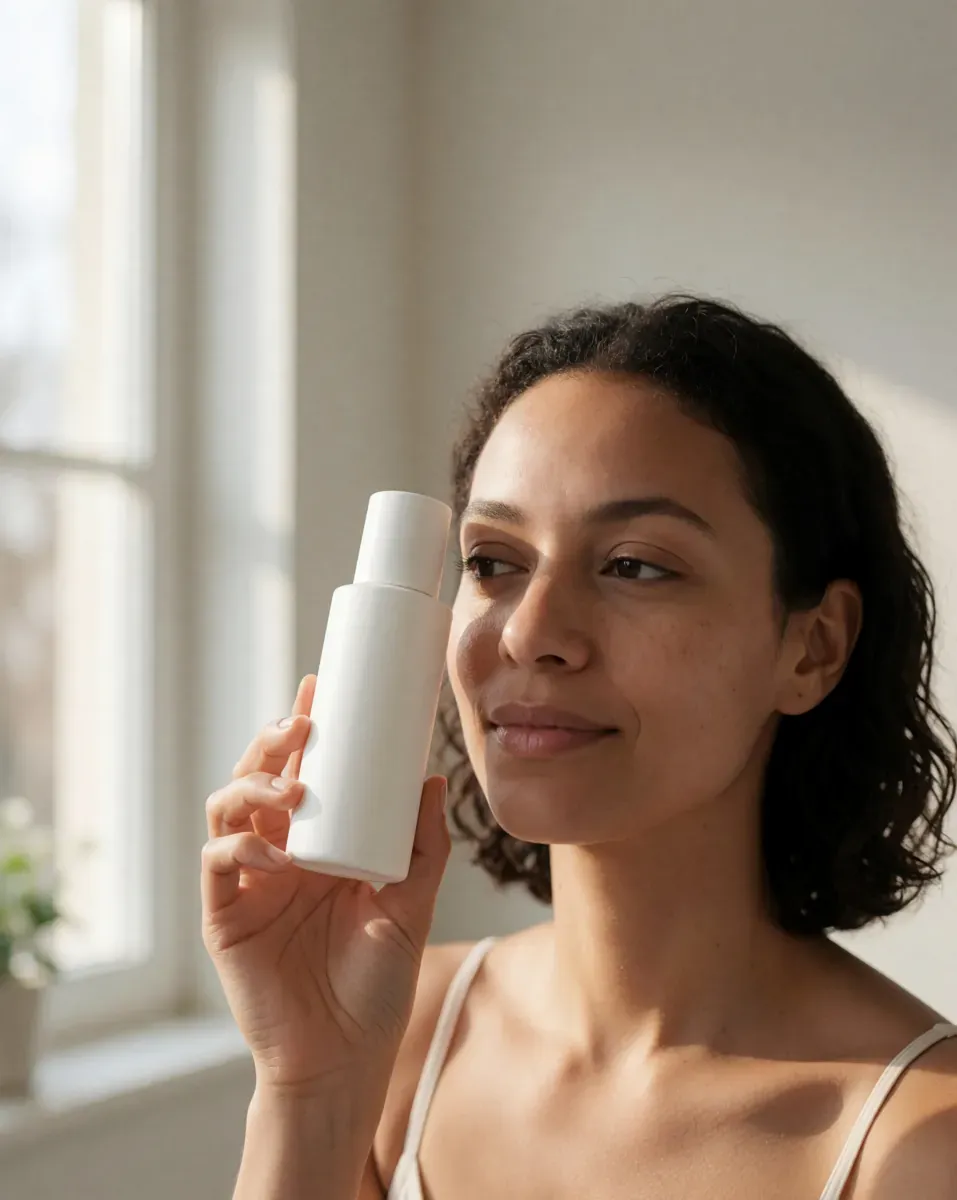
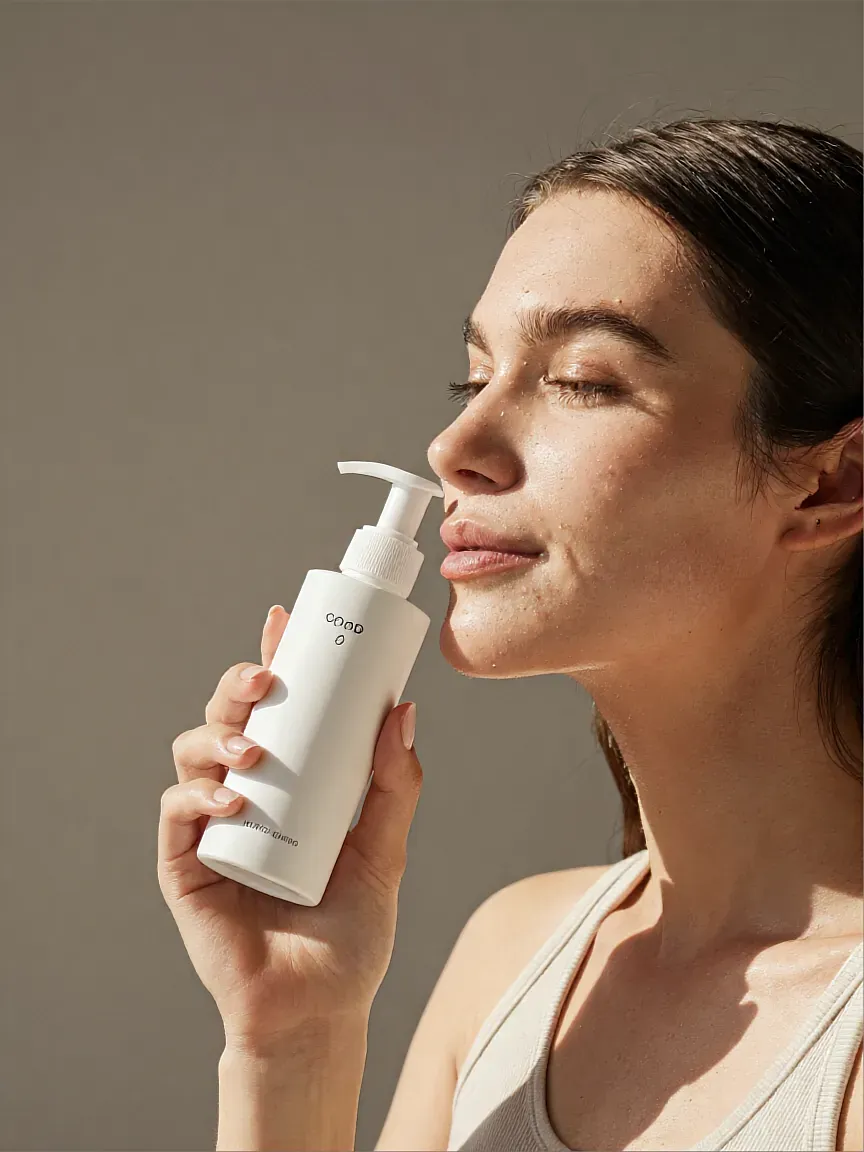
We picked these by the data: pairs the rater decided by a wide margin and the ladder leaders got wrong. All scores in this article's image pairs are for the images as shown to the rater.
MOSS Image
Z-Image Turbo
task_3_3The Z-Image Turbo sign is cleanly rendered and misspelled. The metrics have no way to read it. This is a limit of the method more than a failure of any one model: a no-reference metric never sees the prompt.
Neither of the next two tasks asks for text, so reading is not the whole explanation.
Krea 2 Turbo
Z-Image Turbo
task_7_3
MOSS Image

Z-Image Turbo
task_1_1The case for NR-IQA metrics
A defender of these metrics has real arguments, and some of them hold.
- The ladder result is not noise. 12 of 23 metrics have an interval above zero on the ladder, and 11 beat a coin flip on accuracy. With three raters per pair and 1,152 pairs, that set is far stronger than the blind test.
- The blind test may be the outlier. One rater, three models, and many non-photographic tasks are all unlike what these metrics were built for. maniqa, for example, was built to improve performance on GAN-based distortion. Choosing between clean generations from strong models is a different task.
- Our question is harder than the metrics' intended use. We ask which of two polished images a professional prefers. Catching a blurred, broken or compressed output is a different job, and we did not test it.
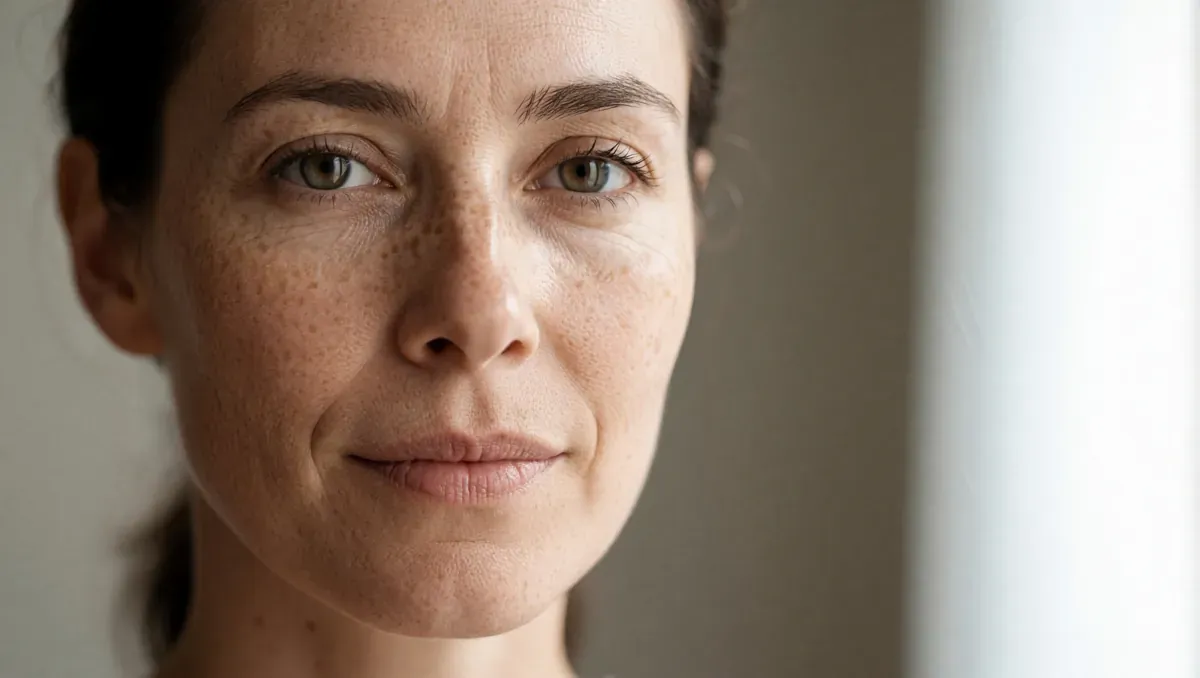
The metrics and the rater do agree on some pairs. On this portrait all six leading metrics picked the same winner as the rater.
Krea 2 Turbo

MOSS Image
task_5_1The blind-test votes can also be questioned. In this pair the prompt asks for a metro platform. Z-Image Turbo shows one, Krea 2 Turbo shows a plain wall, and the rater still gave Krea 2 Turbo all three scales, prompt adherence included. With one rater we cannot tell whether that is a considered call or a slip, which is the reason to rerun the test with a panel.
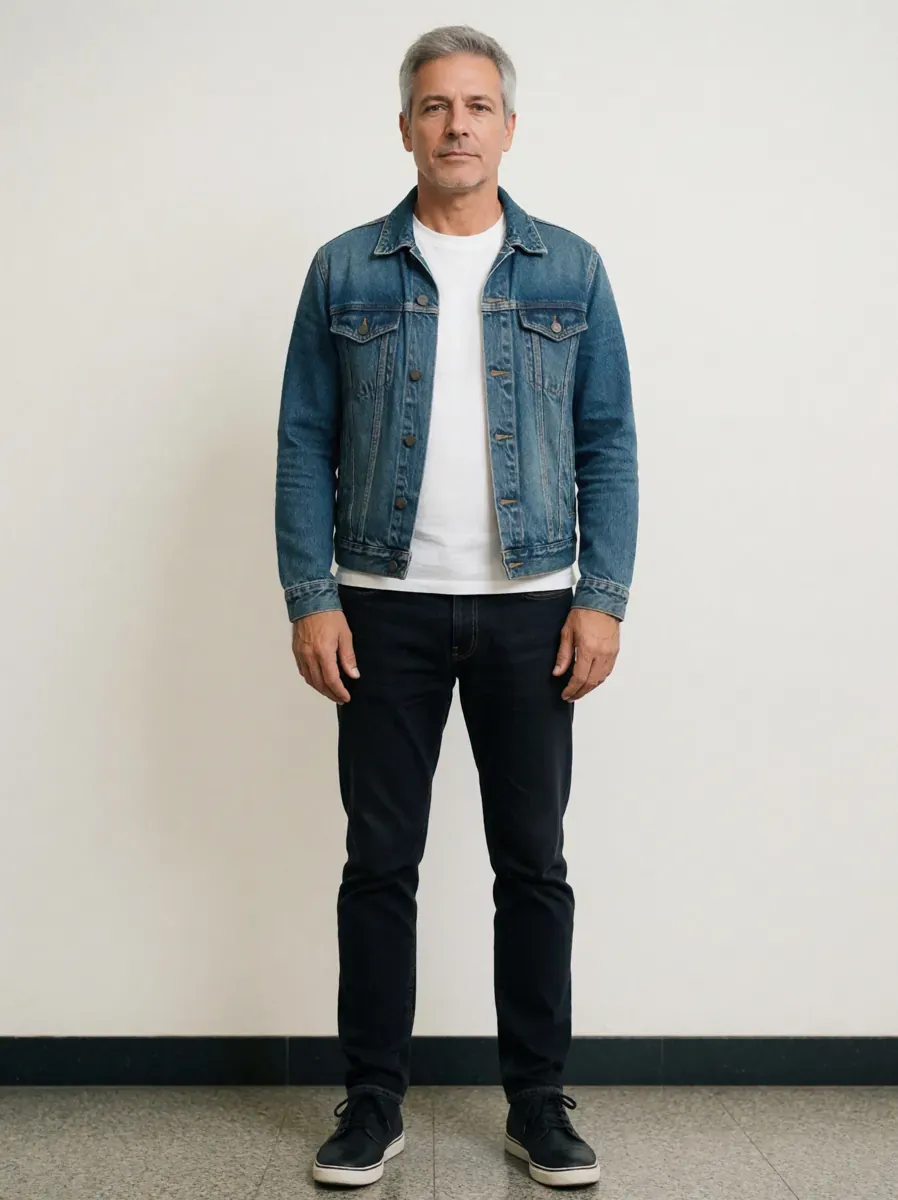
Krea 2 Turbo
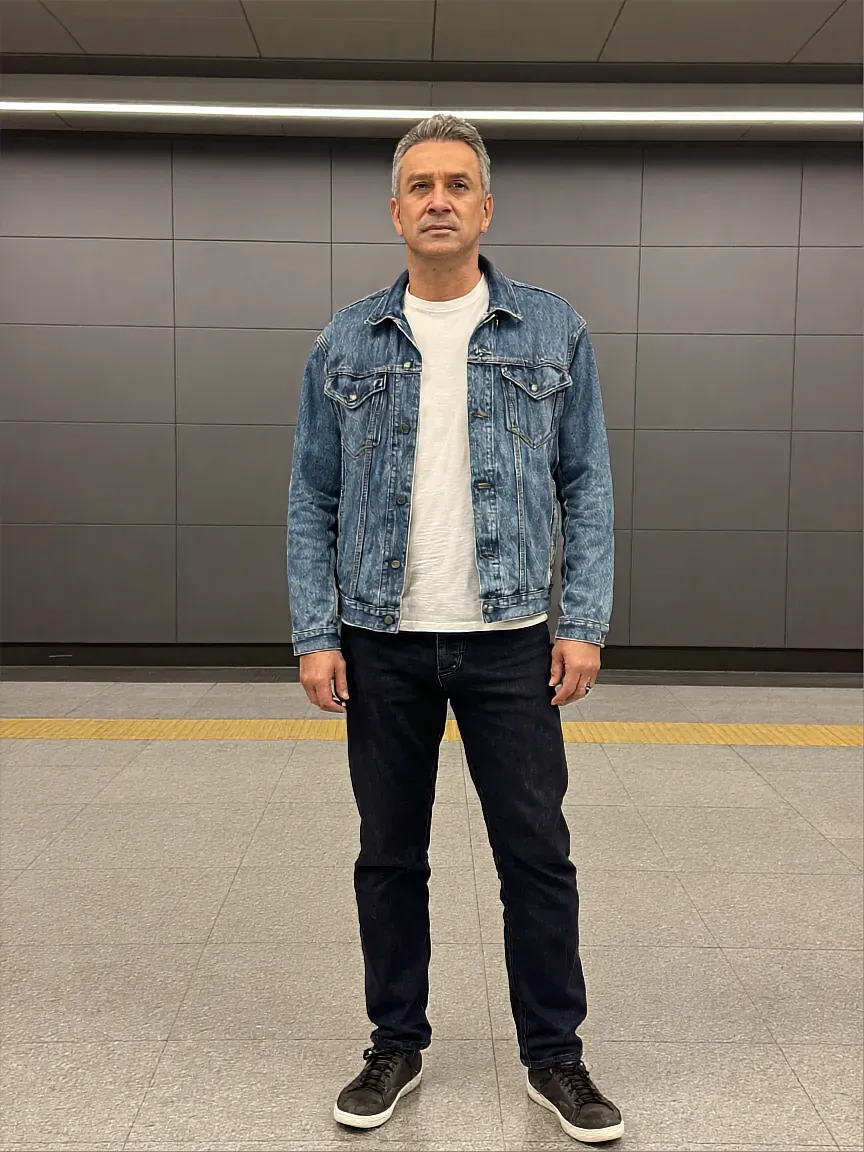
Z-Image Turbo
task_5_4We accept all three. They limit what the blind test proves. They do not change Finding 3, which comes from the ladder alone and needs no help from the smaller set.
What the results suggest for image evaluation
| Task | What this test suggests | Basis |
|---|---|---|
| Replace raters in a pairwise model test | Not supported | No metric above zero on both sets; Finding 1 |
| Pick the better of two images in one matchup | No usable signal | ρ between −0.07 and +0.07 on the ladder; Finding 3 |
| Rank models or tiers | Unreliable, even on the set where a metric leads | Floor ranked above mid; Finding 5 |
| Choose one metric from a published ranking | Needs revalidation on your own images | Leaders differ between sets; Finding 1 |
| Filter obvious technical failures before review | Not tested here | No distorted images in either set |
What we did not test
- Metric combinations or a learned ensemble. Each metric was scored alone.
- Deliberately degraded images, where NR-IQA is on home ground.
- Prompt-aware metrics. All 23 are no-reference by design.
- Inter-rater agreement on the blind test, which has one rater.
- Human agreement for Qwen Image 2.0 Pro and Seedream 4.0 in the within-matchup check.
- Metric retraining or calibration on our votes.
The next step is to rerun the blind test with three raters per pair and a broader set of models, since that removes the two largest limits at once. A metric that survives there would deserve a place next to human review. Humans stay the evaluators until one does.
Frequently asked questions
Can image quality metrics replace human raters?
Not in our November 2026 analysis. None of 23 NR-IQA metrics had a 95% interval above zero on both test sets, and inside one model-anchor matchup they fell to about zero while raters kept agreeing with each other.
Which NR-IQA metric is best for AI-generated images?
We cannot name one. topiq_nr led our 1,152-pair ladder at ρ +0.37, and unipercept_iqa led the 72-pair blind test at +0.25, but neither transferred. Validate any metric on your own images and task before relying on it.
Is 66% accuracy good for an image quality metric?
It sounds better than it is. On 576 published ladder pairs, a rule that ignores the image and picks each matchup's usual winner scored 0.67 against topiq_nr's 0.66, so that accuracy mostly reflects knowing the group.
Why do metrics prefer images people reject?
No-reference metrics do not see the prompt and do not read text, so a clean image with a misspelled sign can outscore a correct one. Beyond that, our data shows a strong model-level effect. The exact cause is not tested.
Are human raters any more reliable than metrics?
Agreement is low: AC1 on believability was 0.13 for Seedream 5 Pro. Yet across pairs one rater predicts the other two about as well as topiq_nr does, and inside one matchup raters stay at ρ 0.24 while topiq_nr drops to 0.01.
Are LLM judges better than image quality metrics?
We have not compared them directly. Our LLM test used upscaled images and a different reference label, so 63% there and 66% here are not comparable. Both approaches failed to justify replacing raters on their own tests.
About Everypixel and this test
Everypixel runs a platform where production teams generate, select and license AI visuals, and research.everypixel.com publishes the team's structured model evaluations. The raters are members of the Everypixel production team who work on stock, advertising and editorial content. Of the 48 reference photographs behind the ladder prompts, 38 come from Everypixel's own production and 10 from Unsplash.
Disclosure: Everypixel conducted this analysis. Z-Image Turbo in the blind test ran through Everypixel Labs, and Everypixel offers Qwen Image 2 and GPT Image 2, the ladder anchors, so it has a commercial interest in some of the models shown. If you are a vendor or reader and find an error, write to hello@everypixel.com.
Sources
- IQA-PyTorch (pyiqa) github.com/chaofengc/IQA-PyTorch
- MANIQA: Multi-dimension Attention Network for No-Reference Image Quality Assessment github.com/IIGROUP/MANIQA
- Exploring CLIP for Assessing the Look and Feel of Images github.com/IceClear/CLIP-IQA
- UniPercept: Towards Unified Perceptual-Level Image Understanding across Aesthetics, Quality, Structure, and Texture github.com/thunderbolt215/UniPercept
- Improved aesthetic predictor github.com/christophschuhmann/improved-aesthetic-predictor
- Can an AI Judge Replace Human Image Evaluation? journal.everypixel.com/can-an-ai-judge-replace-human-image-evaluation
All external sources accessed November 2026. Links for the other 13 metrics are in nr_iqa_summary.csv in the data archive.
Data
The archive holds the summary table, full correlation tables for both sets, image-level scores for all 23 metrics, the blind-test votes and prompts, and the additional checks used here. The ladder votes behind the within-matchup check are published with the Seedream 5 Pro and GPT Image 2.5 Sunburst articles. The 72 blind-test images are in a separate archive of about 156 MB, supplied for benchmark inspection; the data license does not cover them.
Suggested citation: Everypixel production team. Can Image Quality Metrics Replace Human Raters? 23 NR-IQA Metrics Against Blind Votes. November 2026.
Last reviewed: November 10, 2026
Cite this article
<blockquote cite="https://research.everypixel.com/nr-iqa-metrics-vs-human-raters/"> <p>We scored two blind pairwise tests with 23 no-reference image quality metrics. The leaders of one set failed on the other, and inside a single matchup the metrics lost the signal raters kept.</p> <footer>— <a href="https://research.everypixel.com/nr-iqa-metrics-vs-human-raters/">Can Image Quality Metrics Replace Human Raters? 23 NR-IQA Metrics Against Blind Votes</a>, Everypixel Research, November 2026</footer> </blockquote>
Everypixel Research. (2026). Can Image Quality Metrics Replace Human Raters? 23 NR-IQA Metrics Against Blind Votes. research.everypixel.com. https://research.everypixel.com/nr-iqa-metrics-vs-human-raters/