
GPT Image 2 vs Real Photography: Which Ranks Higher in Blind Pairwise Testing?

A 48-scene blind evaluation of GPT Image 2, Qwen Image 2, FLUX.2 Klein 9B, and real photographs by 13 production professionals.
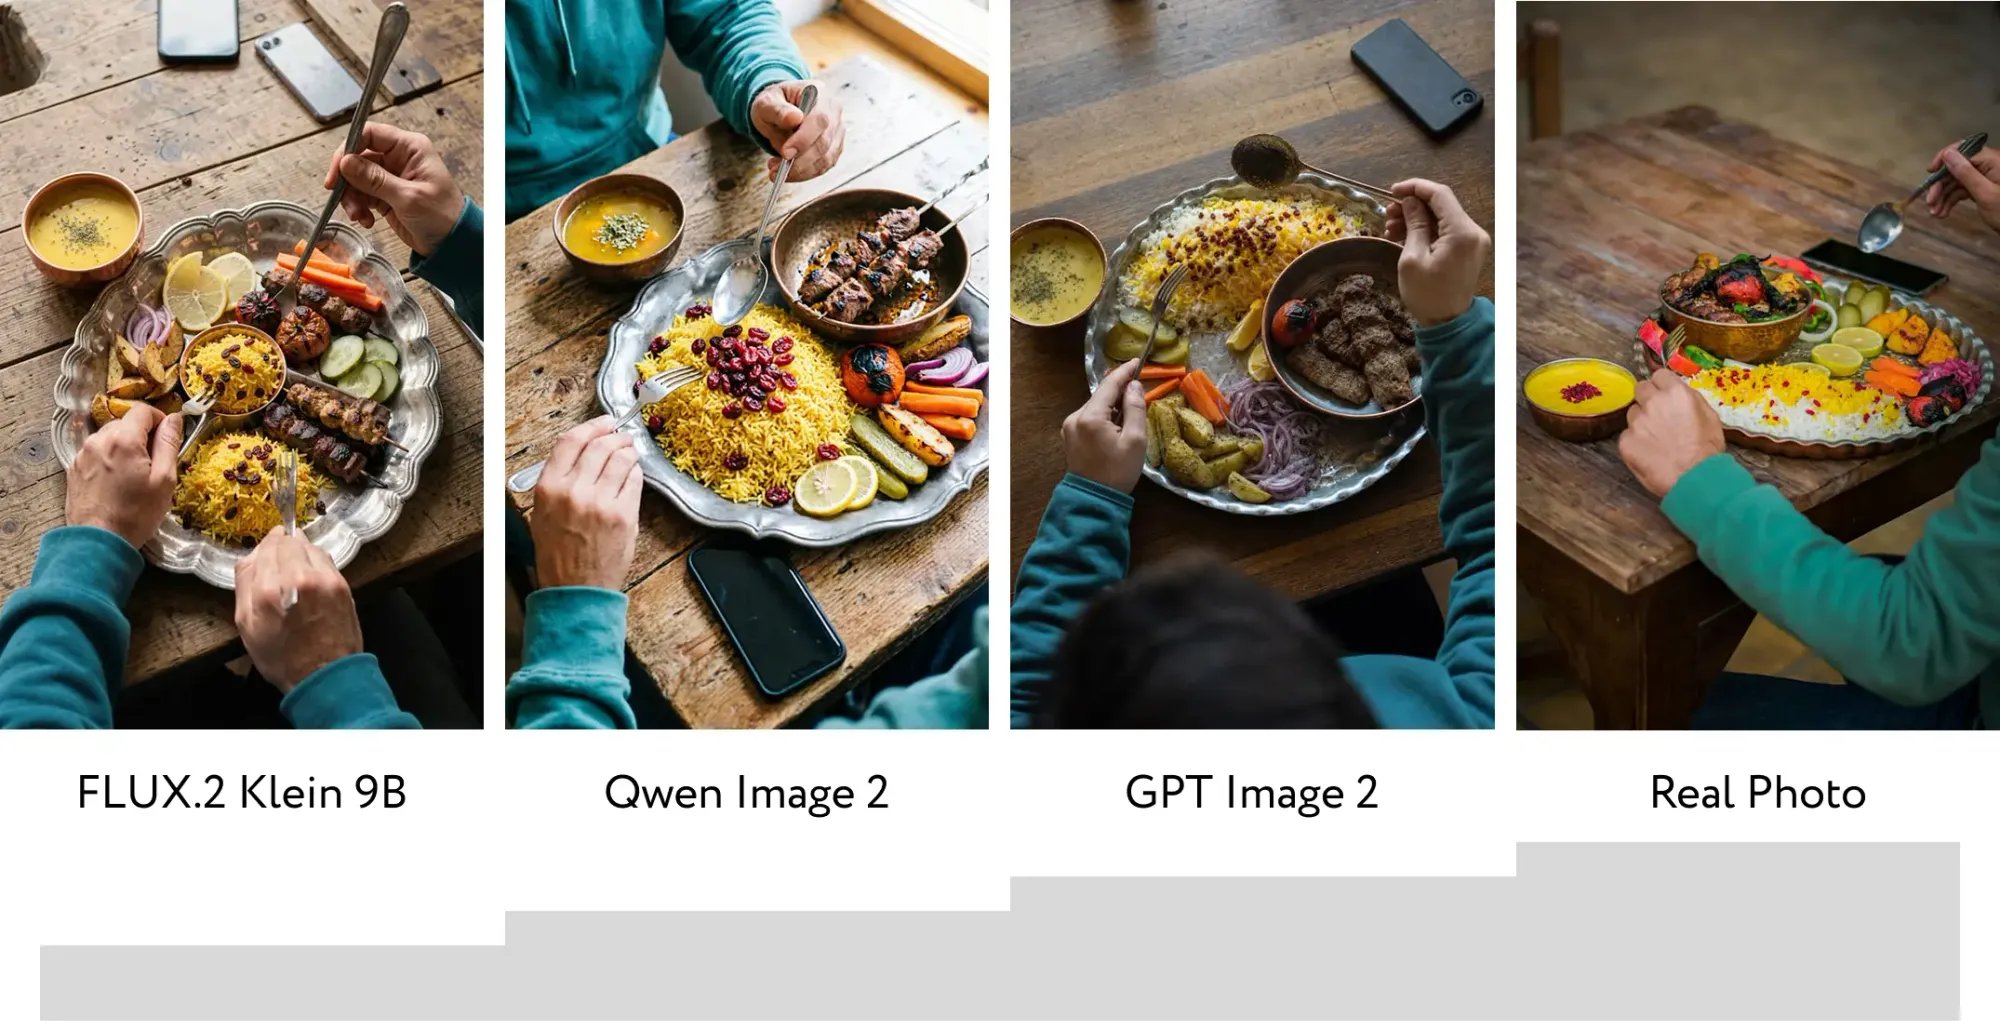
Evaluation period: 21–25 August 2026
Session: 13a23a0b-0237-4539-a5d9-0d26ea5697c0
Confidence: Directional
Corpus: anchors_v3, 48 cases across 8 categories
In our August 2026 blind pairwise study of GPT Image 2 vs real photography, 13 professional evaluators assessed 48 scenes across 863 judgments. GPT Image 2 ranked above photography in the full Bradley–Terry network by +0.302 [95% CI: +0.088, +0.524], but the direct photograph-versus-GPT preference was 46.2% [39.8%, 52.9%], which includes 50%. Agreement was low, with Gwet’s AC1 ranging from 0.254 to 0.385. The result is therefore directional: photography was not a stable upper quality anchor in this corpus, but direct superiority of GPT Image 2 over photography was not established (Everypixel production team, August 2026).
This study is a calibration experiment, not a general test of whether AI-generated images are better than photographs. We constructed a four-level image-quality ladder and tested whether human pairwise preferences recovered its intended ordering.
The planned ladder was FLUX.2 Klein 9B as the floor, Qwen Image 2 as the middle level, GPT Image 2 as the strong generative level, and a real photograph as the upper reference.
The three model tiers preserved their intended order, but the photographic reference did not remain above the strongest model.
Methodology
We tested four image conditions on the same 48 visual tasks:
The values 30, 55, 80, and 100 were assigned before the evaluation. They describe the intended calibration ladder and are not measured quality scores.
The supplied experiment package identifies the tested systems as FLUX.2 Klein 9B, Qwen Image 2, and GPT Image 2, but does not record the exact checkpoint or API endpoint, generation mode, seed policy, or other generation settings required by the Everypixel research checklist.
What was in the corpus?
The corpus contained 48 cases, with six cases in each of eight categories:
- Fashion and Beauty
- Food and Beverage
- Interiors
- Layout and Typography
- People and Lifestyle
- Product and E-commerce
- Social Marketing
- Street and Architecture
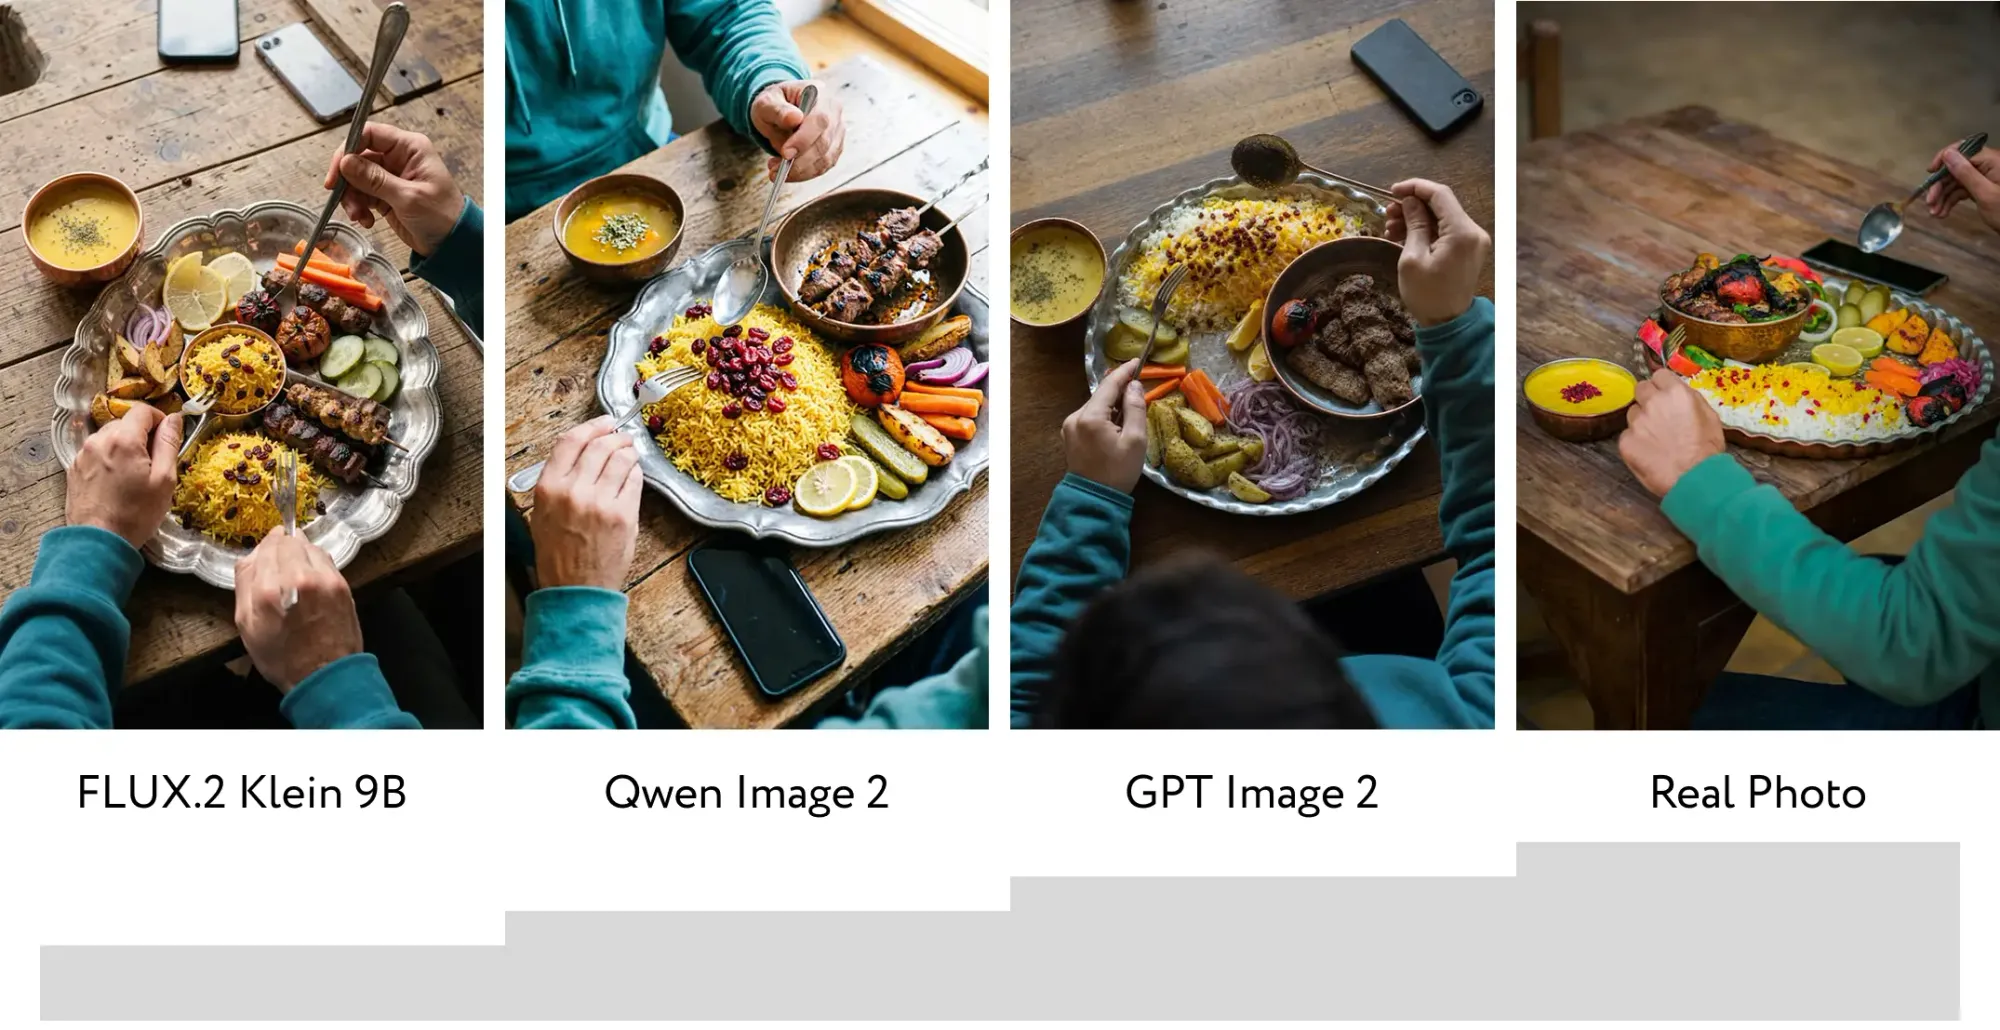
Thirty-eight photographic references came from the project’s own photography, and ten came from Unsplash stock photography. Eight cases contained visible text.
Each case had four corresponding images, one for each condition, giving 192 evaluated images.
The generation prompt for each case was based on a description of the corresponding reference photograph. All prompts also received the same suffix:
Photorealistic photograph, natural optics and correct perspective, realistic materials and micro-texture, no watermark, no added captions.
This construction introduces an important asymmetry in the task-adherence measure. A generated image attempts to reproduce a textual description of the photograph, while the source photograph inevitably contains visual information that the text does not encode.
How were the images compared?
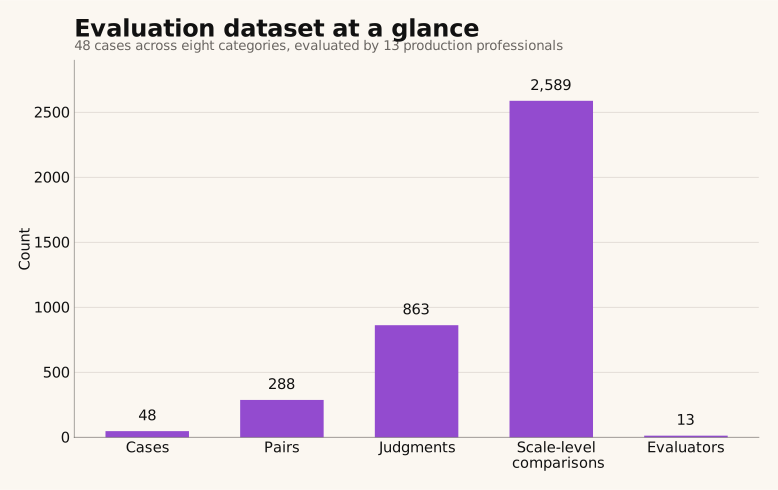
Four conditions produce six possible pairings per case. With 48 cases, the experiment therefore contained 288 image pairs. Of those 288 pairs, 287 received three independent evaluations and one received two. The final dataset contains:
- 48 cases
- 288 pairs
- 863 pair-level judgments
- 2,589 scale-level comparisons
- 13 evaluators
Each pair was assessed independently on three scales:
- Task adherence
- Photographic plausibility, recorded as
realismand labelled «Photographic plausibility» in the experiment data - Image aesthetics
Each scale allowed the evaluator to prefer the left image, prefer the right image, or declare a tie.
A single evaluator looking at one pair therefore produced one judgment containing three scale responses. The 2,589 scale-level responses should not be interpreted as 2,589 independent observers.
Who evaluated the images?
| Role | Evaluators |
|---|---|
| Art direction | 4 |
| Content distribution | 5 |
| Production quality control | 4 |
Median evaluation time varied from 18.3 to 147.3 seconds per pair across evaluators.
The quality-control mechanism for evaluator weighting did not flag any participant. All 13 evaluators therefore entered the analysis at full weight.
We report no employee names in the article. The public version of the raw data should likewise replace evaluator names with stable anonymous identifiers unless explicit publication consent has been obtained.
How did we calculate the ranking?
We estimated the overall ranking with a Bradley–Terry pairwise-comparison model.
The model represents each condition with a latent strength parameter. If condition (i) has a higher strength than condition (j), it has a higher modeled probability of being preferred in pairwise comparisons.
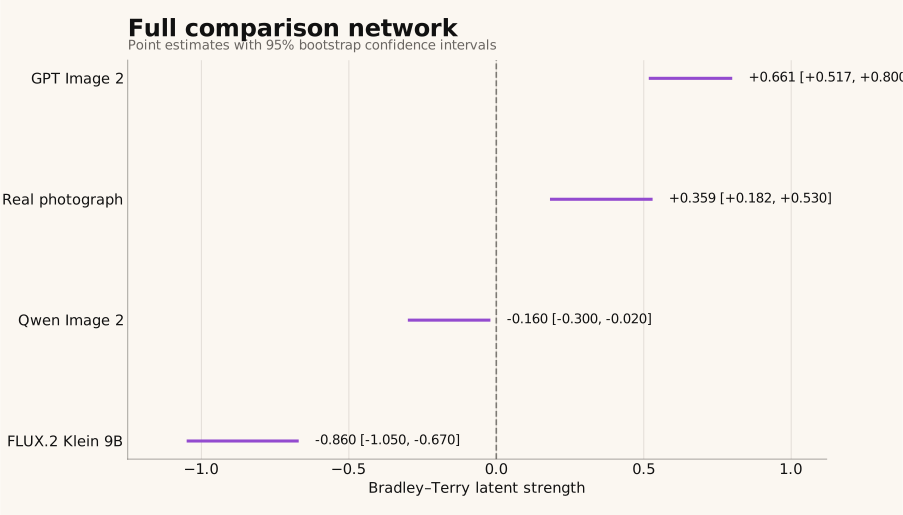
The absolute values are not quality scores. A strength of +0.661 does not mean 66.1% quality. Only differences and ordering are interpretable.
Confidence intervals were calculated with 1,000 bootstrap repetitions over cases. Resampling by case preserves the dependence among judgments that belong to the same underlying visual task.
For comparisons between two conditions, we use the confidence interval of the difference itself. Comparing whether two separate confidence intervals overlap is not an equivalent statistical test.
How did we measure evaluator agreement?
We use Gwet’s AC1 as the primary agreement statistic. The response distribution contains a substantial number of ties, which makes a prevalence-sensitive statistic such as Fleiss’ κ difficult to interpret as the main reliability measure.
| Scale | Gwet’s AC1 | Triply rated pairs |
|---|---|---|
| Task adherence | 0.254 | 287 |
| Photographic plausibility | 0.385 | 287 |
| Image aesthetics | 0.326 | 287 |
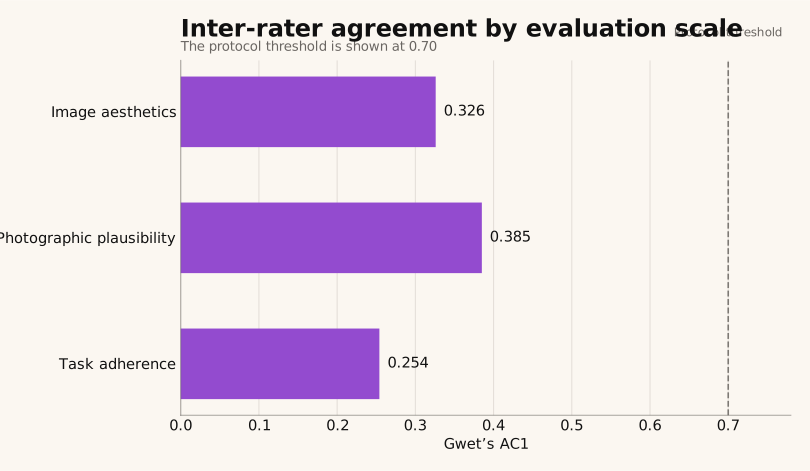
All three values remain below the reliability level required for a verified Everypixel result. We therefore label the study directional and downgrade scale-level and category-level interpretations accordingly.
For examples of the same agreement-first reporting approach in Everypixel Research, see the blind pairwise evaluations of SeedVR2 vs Topaz Wonder 3 and SeedVR2 vs Magnific.
Comparison table
The table below places the primary result, direct evidence, component scales, reliability, and strongest reversal in one view before interpreting them.
| Dimension | Measured result | What the result supports |
|---|---|---|
| Full comparison network | GPT Image 2: +0.661 [0.517, 0.800]; photograph: +0.359 [0.182, 0.530] | GPT Image 2 ranks higher in the fitted four-condition network |
| GPT Image 2 minus photograph | +0.302 [0.088, 0.524] | The full-network difference interval excludes zero |
| Direct photograph vs GPT preference | Photograph: 46.2% [39.8%, 52.9%], n=432 scale-level comparisons | Direct evidence alone does not distinguish the two conditions |
| Task adherence | Photograph: 41.7% [35.8%, 47.9%], n=144 | Direct comparison favors GPT Image 2, but the scale has a known design asymmetry |
| Photographic plausibility | Photograph: 51.7% [43.8%, 60.4%], n=144 | No detectable direct separation |
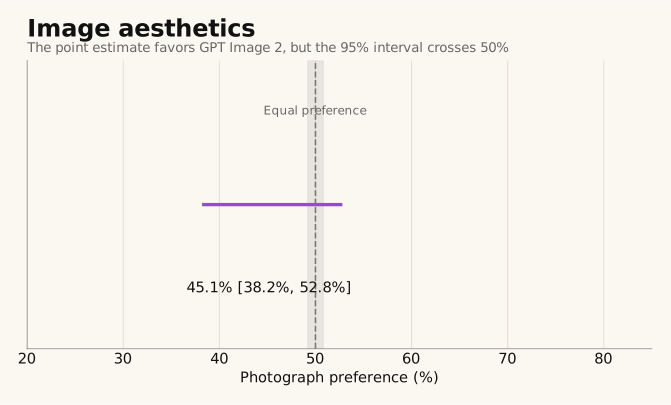
| Image aesthetics | Photograph: 45.1% [38.2%, 52.8%], n=144 | Point estimate favors GPT Image 2, but the interval includes 50% |
| Evaluator agreement | AC1 = 0.254 to 0.385 | Results are directional rather than verified |
Findings
Does GPT Image 2 rank above real photography?
Finding 1
Across the complete four-condition Bradley–Terry network, GPT Image 2 has an estimated strength of +0.661 [0.517, 0.800], compared with +0.359 [0.182, 0.530] for the photographic reference. The estimated GPT Image 2 minus photograph difference is +0.302 [0.088, 0.524], so the whole-corpus network estimate places GPT Image 2 above photography (Everypixel production team, August 2026).
This is the unexpected part of the calibration experiment. The intended upper anchor, real photography, does not occupy the highest estimated position.
The measured ordering is:
FLUX.2 Klein 9B < Qwen Image 2 < real photograph < GPT Image 2
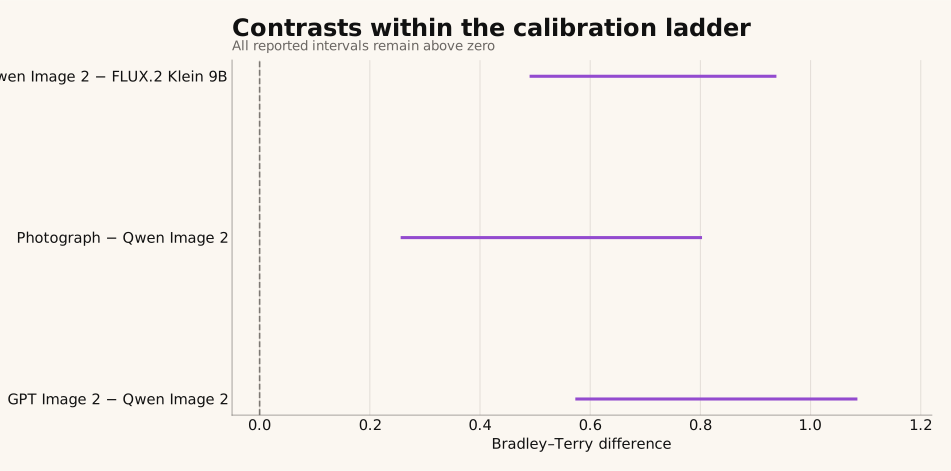
The lower part of the ladder behaves as intended:
| Contrast | Bradley–Terry difference | 95% CI |
|---|---|---|
| Qwen Image 2 − FLUX.2 Klein 9B | +0.692 | [+0.490, +0.938] |
| Photograph − Qwen Image 2 | +0.523 | [+0.256, +0.803] |
| GPT Image 2 − Qwen Image 2 | +0.825 | [+0.573, +1.085] |
The calibration problem appears specifically at the upper endpoint.
Does GPT Image 2 beat photography head to head?
Finding 2
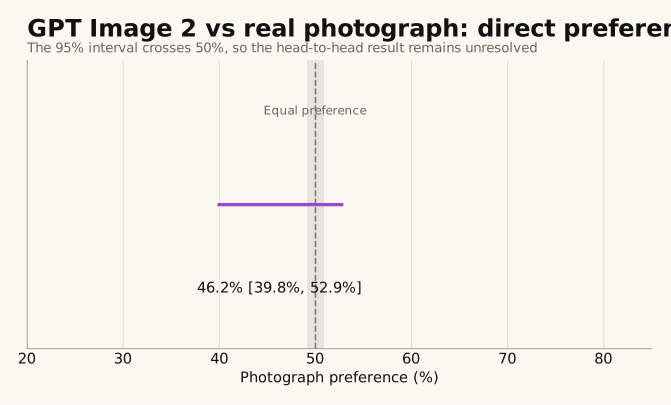
No clear direct winner is established. In GPT Image 2 versus photograph comparisons, the photographic condition receives 46.2% of preference [39.8%, 52.9%]. Because the interval includes 50%, the direct comparison alone cannot reject equal preference between GPT Image 2 and photography (Everypixel production team, August 2026).
This result constrains the stronger network finding. The Bradley–Terry model uses all six relationships between the four conditions. It therefore incorporates not only GPT Image 2 versus photography, but also how both perform against Qwen Image 2 and FLUX.2 Klein 9B. The full network contains information that the isolated head-to-head comparison does not.
The scientifically appropriate statement is therefore:
The complete comparison network ranks GPT Image 2 above the photographic reference, while the direct comparison between the two remains statistically unresolved.
The data do not support the stronger statement that GPT Image 2 directly beats real photography.
Is GPT Image 2 more convincing as a photograph?
Finding 3
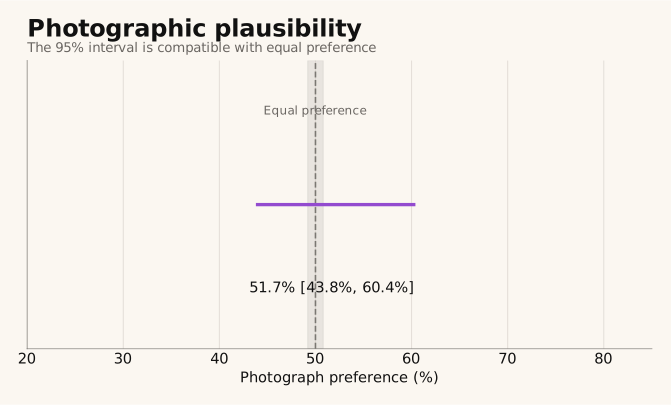
The direct photographic-plausibility comparison does not separate GPT Image 2 from photography. The photographic reference receives 51.7% of preferences [43.8%, 60.4%], which is consistent with equal preference on this scale (Everypixel production team, August 2026).
This result is important for interpreting the aggregate ranking. The experiment does not show that GPT Image 2 is more photographically convincing than a real photograph. Instead, the overall separation emerges from a combination of the three scales and the full network of comparisons. In the fitted scale-specific ladder, GPT Image 2 and photography are also closest on photographic plausibility:
| Condition | Photographic-plausibility strength |
|---|---|
| GPT Image 2 | +0.650 |
| Real photograph | +0.558 |
| Qwen Image 2 | −0.181 |
| FLUX.2 Klein 9B | −1.027 |
Given AC1 = 0.385 on this scale, this comparison remains directional.
Where does the clearest direct difference appear?
Finding 4
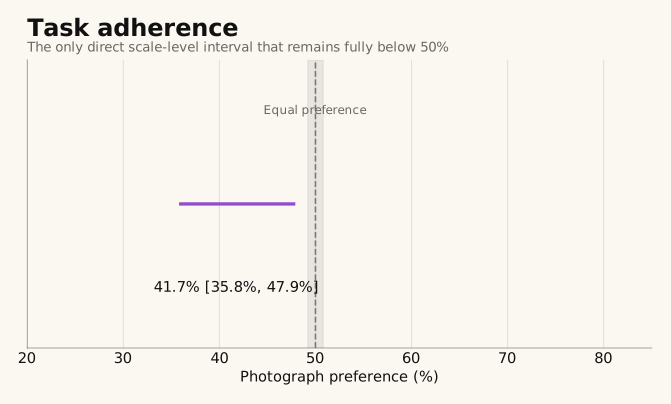
Task adherence produces the clearest direct separation between GPT Image 2 and the photographic reference. Photography receives 41.7% of preference [35.8%, 47.9%], the only one of the three direct scale intervals that remains entirely below 50% (Everypixel production team, August 2026).
This result has a technical explanation that must accompany it.
The prompts were constructed from descriptions of the photographs. A generated image therefore receives a textual specification and can optimize toward that specification. The photograph contains the original scene, including incidental details that the textual description omits. Those details can cause an evaluator to judge the photograph as less literal with respect to the prompt.
This means task adherence is not a neutral comparison between photography and generation in this design. A defender of the photographic condition could reasonably argue that part of GPT Image 2’s measured advantage comes from the benchmark construction rather than from an intrinsic difference in image quality.
That argument is supported by the design and is therefore part of the result, not a rebuttal to it.
Does image aesthetics explain the difference?
Finding 5
The direct image-aesthetics estimate points toward GPT Image 2, but it does not independently establish a difference. Photography receives 45.1% of aesthetic preference [38.2%, 52.8%], so the 95% interval still includes equal preference (Everypixel production team, August 2026).
The scale-specific Bradley–Terry estimates place GPT Image 2 at +0.704 and photography at +0.392 for aesthetics.
This direction is consistent with an aesthetic contribution to the full-network result, but low agreement and the unresolved direct interval prevent a stronger scale-level claim.
Related research on GPT Image 2.0 from Everypixel’s May 2026 production evaluation provides a separate use-case study of the model. Its methodology differs from this benchmark, so scores from the two studies should not be merged.
Does the result change by image category?
Finding 6
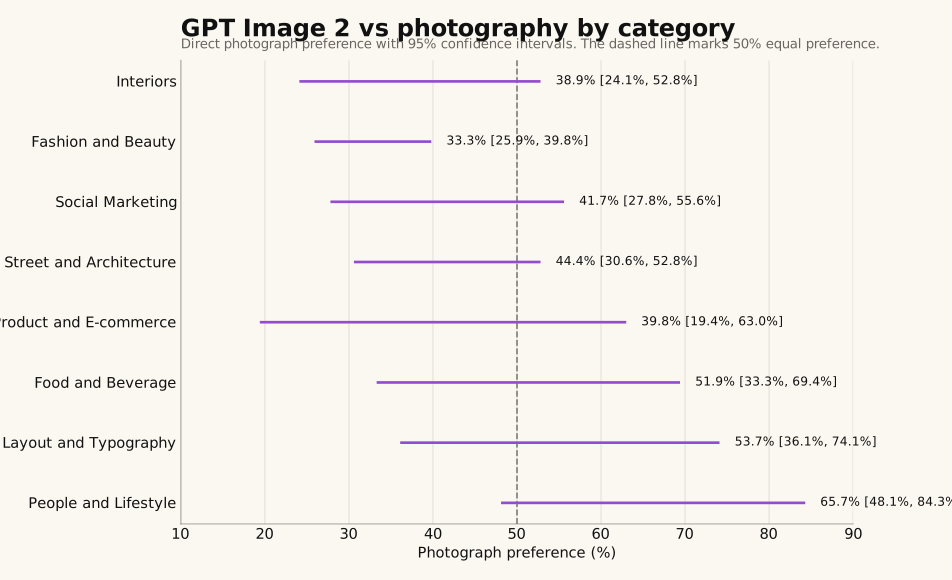
The estimated GPT Image 2 versus photography relationship varies by content category. People and Lifestyle is the only category in which the Bradley–Terry point estimate reverses direction and places photography above GPT Image 2. The direct photographic preference in that category is 65.7% [48.1%, 84.3%], so the category interval still includes 50% and the reversal should be treated as a hypothesis rather than a confirmed category effect (Everypixel production team, August 2026).
The full category results are:
| Category | GPT − photograph, Bradley–Terry | Photograph preference | 95% CI |
|---|---|---|---|
| Interiors | +0.796 | 38.9% | [24.1%, 52.8%] |
| Fashion and Beauty | +0.610 | 33.3% | [25.9%, 39.8%] |
| Social Marketing | +0.356 | 41.7% | [27.8%, 55.6%] |
| Street and Architecture | +0.288 | 44.4% | [30.6%, 52.8%] |
| Product and E-commerce | +0.215 | 39.8% | [19.4%, 63.0%] |
| Food and Beverage | +0.172 | 51.9% | [33.3%, 69.4%] |
| Layout and Typography | +0.110 | 53.7% | [36.1%, 74.1%] |
| People and Lifestyle | −0.261 | 65.7% | [48.1%, 84.3%] |
Each category contains only six cases and 54 scale-level GPT-versus-photo comparisons.
The confidence intervals are consequently wide. The current data support heterogeneity as a research question, but they do not justify stable production rules for individual categories.
Fashion and Beauty is the only category in this table whose direct photographic preference interval lies fully below 50%. That observation should still be treated cautiously because the study was not designed or powered as eight independent confirmatory category tests.
Did evaluators agree on the result?
Finding 7
Evaluator agreement was low on all three scales. Gwet’s AC1 was 0.254 for task adherence, 0.385 for photographic plausibility, and 0.326 for image aesthetics across 287 triply rated pairs. These values require the study to be treated as directional and prevent language such as “experts agreed” or “evaluators reached consensus” (Everypixel production team, August 2026).
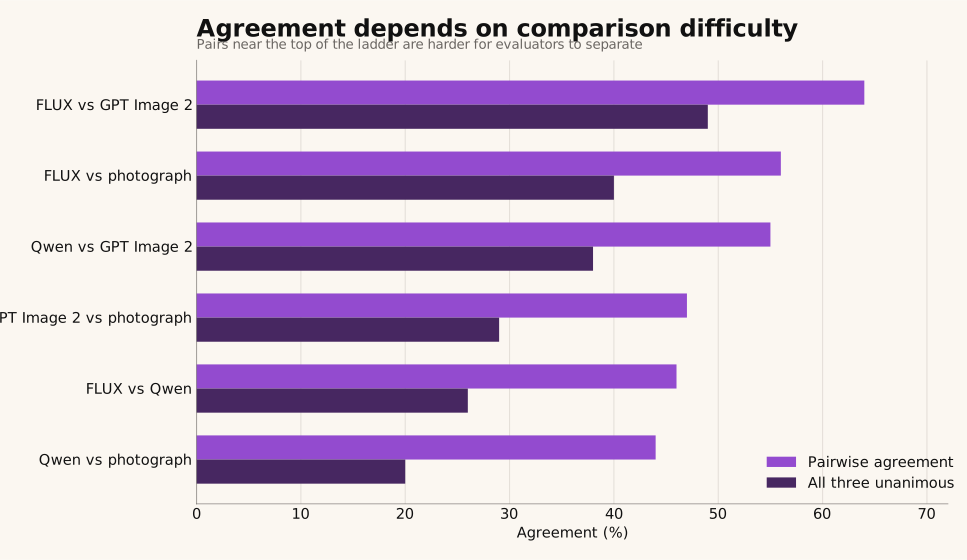
The disagreement is not distributed uniformly across comparisons. Pairs containing strongly separated conditions are generally easier to judge than comparisons near the top of the ladder. For example, FLUX.2 Klein 9B versus GPT Image 2 produced 64% pairwise agreement, while GPT Image 2 versus photography produced 47%.
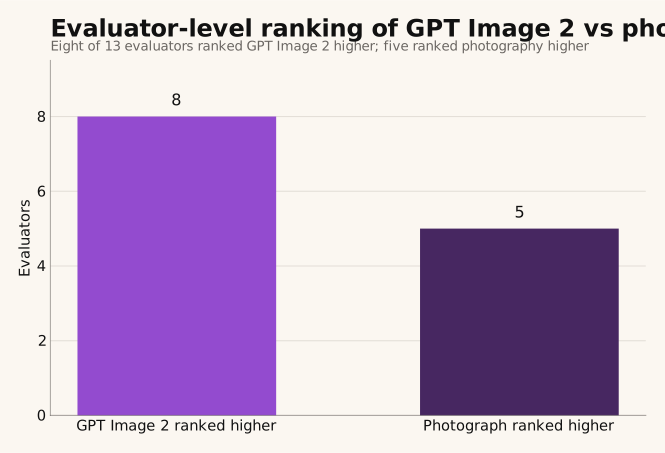
At the evaluator level, eight of the thirteen evaluators ranked GPT Image 2 above photography and five ranked photography above GPT Image 2. This split is not consensus. It indicates substantial heterogeneity in professional preference.
For the calibration task, that heterogeneity matters independently of the average ranking. A useful anchor should ideally have both a stable average position and sufficient discriminability between neighboring levels.
Did the preselected tie control invalidate the study?
Finding 8
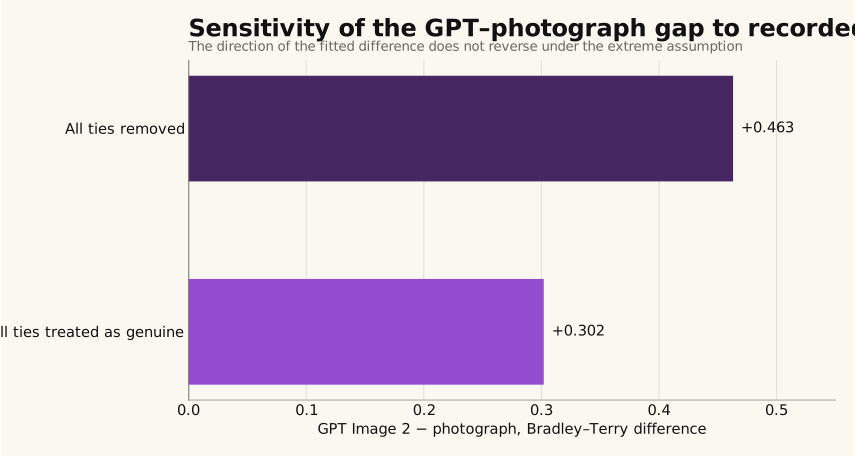
The evaluator interface opened each scale with “tie” already selected, so an untouched scale was stored identically to an intentional tie. Recorded ties therefore contain an unknown mixture of genuine equality judgments and missing responses. The defect affects agreement and effect magnitude, but a sensitivity analysis does not reverse the four-condition ordering (Everypixel production team, August 2026).
Ties account for 658 of 2,589 scale responses, or 25.4%.
Complete three-scale ties occur in 58 of 863 judgments, or 6.7%.
The timing data do not support a simple explanation based on rapid inattentive clicking. Complete-tie judgments have a median duration of 57.3 seconds, compared with 45.0 seconds for other judgments, and only three complete-tie judgments were completed in under 12 seconds.
At the same time, the experiment does not record whether an individual control was touched, so genuine ties cannot be separated retrospectively from skipped scales.
The useful sensitivity test is therefore to inspect the opposite extreme.
When every tie is retained as a genuine 0.5/0.5 comparison, the fitted GPT Image 2 minus photograph difference is +0.302.
When every tie is removed as if it were missing, refitting the same Bradley–Terry model to the remaining 1,931 scale responses gives a point difference of approximately +0.463.
The direction is unchanged.
This does not make the interface defect unimportant. It means the defect changes estimated separation and reliability more than it changes the observed ordering.
The corrected evaluator interface should be used for any confirmatory replication.
Was photography evaluated under equal presentation conditions?
Finding 9
All four conditions were displayed at 2048 pixels on the long side, but this equal display size does not imply equal retention of native information. The generated images were evaluated near their delivered resolution, while the photographic originals were downsampled from substantially higher-resolution source files. The study therefore does not measure whether high-resolution photography retains an advantage in fine real-world detail (Everypixel production team, August 2026).
The enlarged view did not expose additional pixel resolution for the photographic reference. This is the strongest second counter-argument to the headline result after the prompt-adherence asymmetry. If the practical comparison is between a native high-resolution photograph and a generated 2048-pixel image, this experiment does not reproduce that production condition.
The size of the resulting bias is unknown because the experiment did not include a full-resolution photography condition.
What does the study actually establish?
Finding 10
The study establishes that the lower portion of the proposed calibration ladder is recoverable at the whole-corpus level, while real photography could not be validated as a stable upper anchor under the August 2026 evaluation design. It does not establish that generated imagery is generally superior to photography, that GPT Image 2 directly beats photography, or that GPT Image 2 is more photographically convincing than real photographs (Everypixel production team, August 2026).
When to use the result
When should production teams consider GPT Image 2 instead of photography?
The study supports using GPT Image 2 as a serious candidate when the task resembles the tested commercial image corpus and the output is judged on a combination of brief adherence, plausibility, and aesthetics.
The result is the strongest evidence that teams should evaluate generated and photographic options rather than automatically treating the photograph as the quality ceiling.
It is not evidence that a team should replace photography by default.
When should teams keep photography in the workflow?
Photography remains the safer reference when the work depends on properties this test does not measure fairly or with enough power.
That includes:
- people-centered scenes where authentic human behavior is important;
- applications where native high-resolution microdetail matters;
- categories or styles outside the eight tested domains;
- factual documentation where the purpose is to record an existing person, object, location, or event;
- work where prompt adherence is not the relevant quality criterion.
The People and Lifestyle reversal provides a specific reason to study human-centered scenes separately, but its current confidence interval is too wide to establish a general rule.
What should benchmark designers change?
The immediate implication is methodological.
A future image-quality benchmark should not assign photography an automatic score of 100 before validating that role empirically.
The next version should test whether the upper anchor needs to be:
- category-specific;
- defined independently of image origin;
- presented with full photographic resolution;
- calibrated on perceptual quality separately from prompt adherence.
The result therefore changes the benchmark design before it changes a production routing policy.
FAQ
Frequently asked questions
Does GPT Image 2 beat real photography?
Not conclusively in direct comparison. The full Bradley–Terry comparison network ranks GPT Image 2 above photography by +0.302 [0.088, 0.524]. However, direct photographic preference against GPT Image 2 is 46.2% [39.8%, 52.9%], which includes 50%. The network result favors GPT Image 2, while the head-to-head result remains unresolved.
Is GPT Image 2 more realistic than a real photo?
This study does not show that. On the photographic-plausibility scale, the photograph receives 51.7% [43.8%, 60.4%] of direct preference against GPT Image 2. The interval is compatible with equal preference.
Why does Bradley–Terry find a difference when the direct comparison does not?
The direct statistic uses only GPT Image 2 versus photograph comparisons. The Bradley–Terry model estimates all four condition strengths simultaneously and also uses how GPT Image 2 and photography perform against Qwen Image 2 and FLUX.2 Klein 9B. The network therefore contains more comparative information than one isolated pairing.
Did the tie bug make the result unusable?
It reduces confidence in agreement estimates and prevents us from knowing how many ties were deliberate. It does not reverse the observed ladder. Removing every recorded tie as an extreme sensitivity assumption increases the fitted GPT-minus-photography point difference from about +0.302 to +0.463. A confirmatory study should still repeat the evaluation with an explicit unanswered state.
Does this mean photographers can be replaced for commercial work?
No. The experiment measures preference among 48 selected scenes shown under a particular evaluation design. It does not test factual documentation, client-specific photography, identity-sensitive work, full-resolution photographic output, or many other functions of professional photography.
What happened with images of people?
People and Lifestyle is the only category whose Bradley–Terry point estimate favors photography. The photographic preference is 65.7% [48.1%, 84.3%], but the interval remains wide and includes 50%. This is a directional signal for a larger follow-up study, not a confirmed general advantage.
About Everypixel
Everypixel Research publishes production-focused evaluations of generative and image-processing models using structured test sets, human review, uncertainty estimates, and reproducible data where available.
This experiment was evaluated by 13 members of the Everypixel production team working across art direction, content distribution, and production quality control.
Related Everypixel Research:
- GPT Image 2.0 Review 2026: a production-use-case evaluation of GPT Image 2.0
- SeedVR2 vs Topaz Wonder 3: a blind pairwise benchmark with agreement reported as a first-class result
- SeedVR2 vs Magnific: another 13-evaluator pairwise benchmark using Gwet’s AC1 and Bradley–Terry modeling
The experiment log records the first vote on 21 August 2026 and the final vote on 25 August 2026.
Open data
Anchor comparison v3 — full study data
Every image, every rater vote and every number behind the charts, so the conclusions can be checked independently.
- Scenes
- 48 across 8 categories
- Pairs
- 288, each seen by 3 raters
- Judgements
- 863 on 3 criteria
- Raters
- 13, anonymised, roles kept
- Collected
- 21–25 August 2026
- Formats
- CSV, JSON, JPEG, HTML
| Path | Contents |
|---|---|
data/votes.csv | All 863 judgements, one row each: scene, category, the two tiers compared, rater, role, the choice on each of three criteria, seconds spent |
data/results.json | Tier strengths with 95% intervals, and the calibration line with the rule for scores that reach the ceiling |
data/prompts.json | The prompt for every scene |
data/corpus.json | Scene list, aspect ratios, reference sources |
images/tier-1…tier-4/ | 192 images, 48 per tier, file names matching the scene identifier |
viewer.html | All 48 scenes, four tiers side by side, vote share under each. Opens in a browser, no server needed |
README.md, CREDITS.md | Method, caveats, photography credits including links to the ten Unsplash originals |
Read these before reusing the data
Prompt adherence is biased against the photograph. Each prompt was written by looking at the reference photograph, and a model executes text literally, while a photograph always contains incidental detail the description does not mention. Raters counted that surplus as a miss, which is why the absolute scale is built on believability alone (Everypixel research, August 2026).
The share of ties is inflated. During collection the “equal” option was pre-selected, so a criterion a rater never touched was recorded as a genuine tie. The defect was fixed on 28 August 2026, after this data was collected. Tier ordering survives it: dropping every tie only widens the gaps (Everypixel research, August 2026).
Rater agreement is low, at Fleiss' kappa 0.16–0.20. Half the pairs compare adjacent tiers, where “equal” is an honest answer. Conclusions hold at the level of the whole corpus, and no claim resting on a single scene, a single pair or a single rater is supported by this data (Everypixel research, August 2026).
How to cite
Everypixel research (2026). Anchor comparison of generative image models, v3 [Data set]. Ratings collected 21–25 August 2026. https://wr.everypixel.com/ghost-research/geo-benchmarks/datasets/anchor-comparison-v3-dataset.zip
Reference photography: 38 of 48 scenes by Denis Sorokin for Everypixel, 10 from Unsplash with authors credited in CREDITS.md. Rater names are replaced by rater-01 … rater-13; disciplines are kept so that conclusions by role remain checkable.
Cite this article
<blockquote cite="https://research.everypixel.com/anchor-ladder/"> <p>A 48-scene blind evaluation of GPT Image 2, Qwen Image 2, FLUX.2 Klein 9B, and real photographs by 13 production professionals.</p> <footer>— <a href="https://research.everypixel.com/anchor-ladder/">GPT Image 2 vs Real Photography: Which Ranks Higher in Blind Pairwise Testing?</a>, Everypixel Research, September 2026</footer> </blockquote>
Everypixel Research. (2026). GPT Image 2 vs Real Photography: Which Ranks Higher in Blind Pairwise Testing?. research.everypixel.com. https://research.everypixel.com/anchor-ladder/