Is Seedream 5 Pro Better Than GPT Image 2? A 48-Scene Blind Test

In a blind test by 13 production professionals, Seedream 5 Pro led the frozen Qwen Image 2.0 outputs but trailed GPT Image 2 on believability. Agreement was low; prompt adherence did not separate Seedream from GPT.
Evaluation period: September 30–October 13, 2026 (UTC)
Session: 70869064-b007-4442-a6b2-a8364e416850
Confidence: directional pairwise findings; ladder index withheld
Corpus: anchors_v3, 48 scenes across eight categories
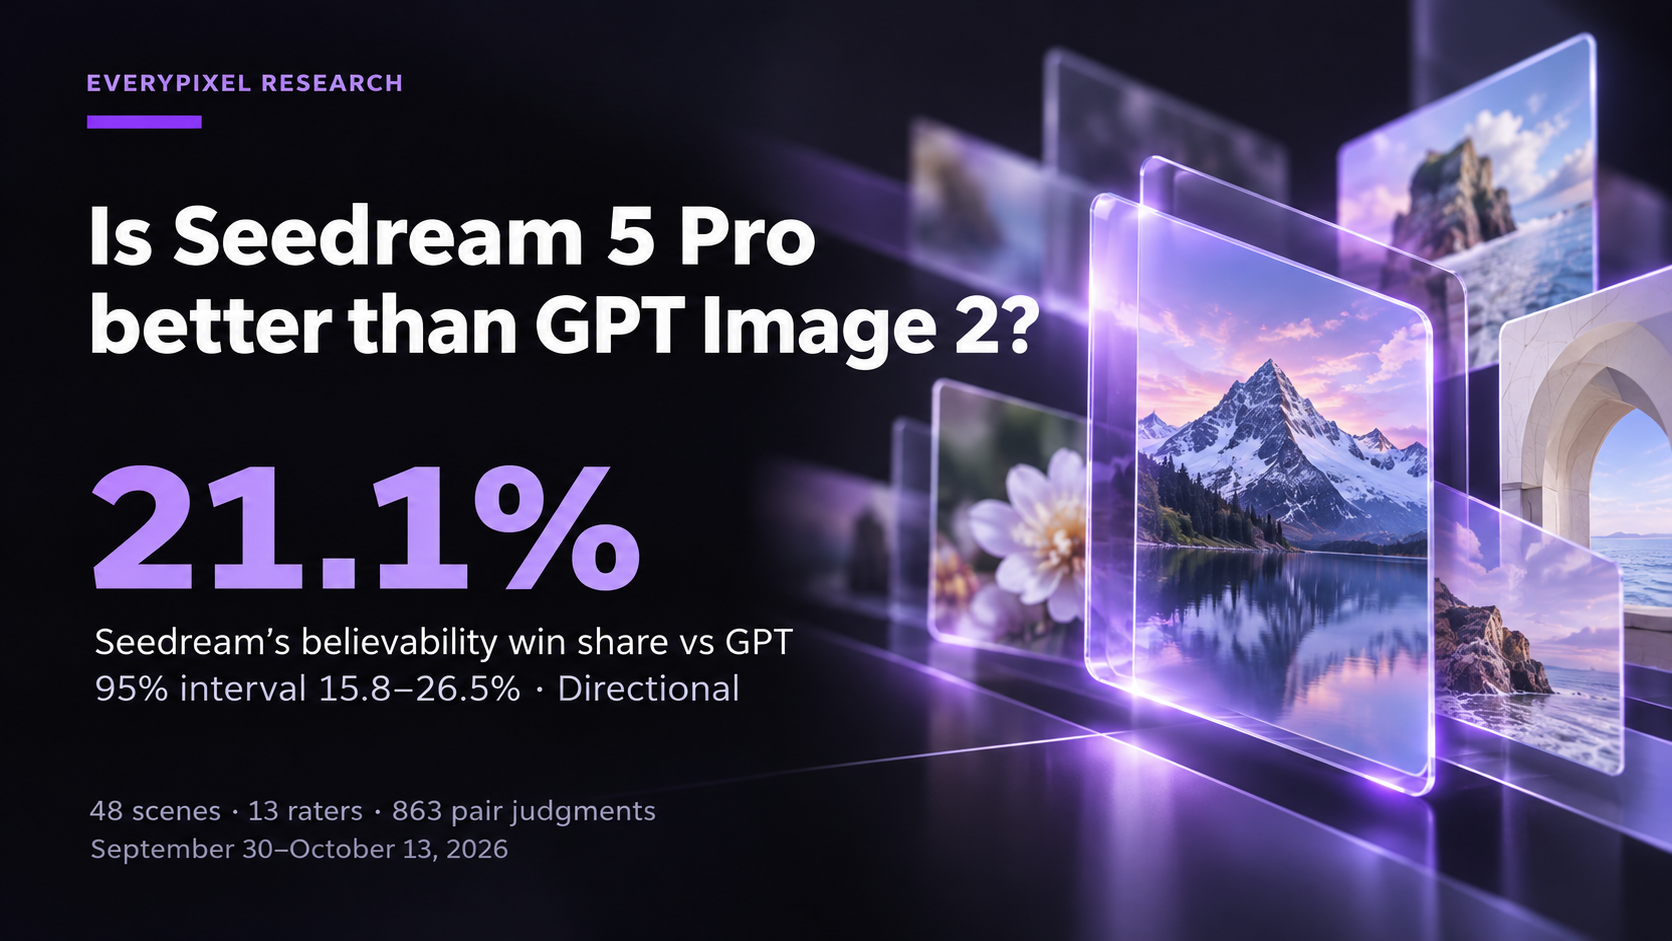
Seedream 5 Pro does not outperform GPT Image 2 on believability in this blind test: it wins 21.1% [95% CI: 15.8–26.5%] and loses 47.3% [95% CI: 40.3–54.2%]. Against Qwen Image 2.0, it wins 46.3% [95% CI: 41.0–51.4%] and loses 25.5% [95% CI: 21.1–30.1%]. These are shares of human judgments on frozen anchor images. Low agreement makes the findings directional (Everypixel production team, October 2026).
Seedream 5 Pro vs GPT Image 2 is a comparison between a new set of generated images and a fixed reference set. We asked production professionals to judge which image followed the prompt, looked more believable, and looked better. The answers put Seedream between the two anchors overall, with meaningful exceptions by scene and evaluator role.
The anchors come from our 48-scene calibration study. Reusing the same reference images makes this an extension of that corpus; it also limits the conclusion to those images. A fresh batch from either anchor model could change the comparison.
How did we test Seedream 5 Pro?
- Tested on September 30–October 13, 2026: Seedream 5 Pro against Qwen Image 2.0 and GPT Image 2. Each of the 48 English prompts describes a photographic scene; there are six scenes in each of eight categories.
- Outputs: three Seedream generations per scene, 144 in total. Each was compared with one frozen image from each anchor, producing 288 distinct pairs. All recorded generations were included.
- Panel: 13 evaluators across art direction, content distribution and production quality assurance. Model names were hidden during comparison. Votes carry equal weight; no role gets a larger vote.
- Coverage: all 864 assigned tasks were submitted. One was explicitly skipped, leaving 863 valid pair judgments. One additional prompt-adherence answer is absent: 863 responses each for believability and aesthetics, 862 for prompt adherence, 2,588 scale responses in total.
- Display: evaluated JPEGs have a 2048-pixel long edge and use the same display pipeline as the anchors. Seedream appeared on the left in 437 of 863 valid pair judgments. The native PNG files were not the evaluation display.
- Snapshot: the exported data fixes the results at October 13. The session remains marked active in the application, although every assigned task has been submitted.
We used WaveSpeedAI’s Seedream V5.0 Pro endpoint with resolution=2k and prompt_optimization_mode=standard. The provider describes this mode as “fuller prompt rewriting.” We submitted the same source prompts used for the anchors, but the provider’s rewritten text is not recorded; this is a test of that configured endpoint, not an isolated model checkpoint.
The endpoint did not expose a seed. The saved images can be inspected, but the manifest does not support regenerating exactly the same pixels from a seed. We did not test the fast optimization mode, other resolution tiers, image editing, or alternative providers.
What do the shares and intervals measure?
A win share is the fraction of answered judgments that explicitly favor Seedream. A tie-adjusted preference share gives a win one point and a tie half a point, then divides by the number of answered judgments. Equal preference is 50% on that second measure; neither measure is a probability that an image will be accepted for production.
For head-to-head intervals, we resample scenes 2,000 times with a fixed seed, drawing six scenes within each category. All judgments and all three generations for a sampled scene move together. The resulting 95% intervals describe variation across scenes with this panel and these recorded outputs; they do not sample new experts, new categories or fresh generations.
The generation design is asymmetric: Seedream contributes three outputs per scene, while each anchor contributes one frozen output. We observe variation among Seedream outputs, but not among fresh outputs from the anchors. The 2,588 scale responses are therefore neither 2,588 independent images nor 2,588 independent observers.
We report Gwet’s AC1, an agreement measure suited to the three-way win/tie/loss responses, using complete three-rater pairs. That leaves 287 pairs for believability and aesthetics, and 286 for prompt adherence. Valid responses from incomplete pairs still count in the preference results; missing answers never become ties.
Why does the ladder use believability, not prompt adherence?
The ladder’s prompts were written from reference photographs. A generator can follow the text literally, while the photograph contains incidental detail that the text omits.
Prompt adherence is consequently an uneven basis for calibrating generated images against photography. The ladder uses believability only; this session does not directly compare Seedream with real photographs.
Seedream 5 Pro vs Qwen Image 2.0 and GPT Image 2: what changed?
| Measure | vs Qwen Image 2.0 | vs GPT Image 2 |
|---|---|---|
| Believability: win / tie / loss | Win 46.3% [95% CI: 41.0–51.4%]; tie 28.2% [95% CI: 24.1–32.4%]; loss 25.5% [95% CI: 21.1–30.1%] | Win 21.1% [95% CI: 15.8–26.5%]; tie 31.6% [95% CI: 26.9–36.4%]; loss 47.3% [95% CI: 40.3–54.2%] |
| Believability: tie-adjusted preference | 60.4% [95% CI: 56.0–64.8%] | 36.9% [95% CI: 31.2–42.7%] |
| Aesthetics: win / tie / loss | Win 65.7% [95% CI: 60.4–70.8%]; tie 13.9% [95% CI: 10.2–17.4%]; loss 20.4% [95% CI: 16.4–24.8%] | Win 29.9% [95% CI: 24.1–35.9%]; tie 27.1% [95% CI: 23.0–31.1%]; loss 42.9% [95% CI: 36.8–49.1%] |
| Aesthetics: tie-adjusted preference | 72.7% [95% CI: 68.3–76.9%] | 43.5% [95% CI: 37.9–49.2%] |
| Prompt adherence: win / tie / loss | Win 32.2% [95% CI: 25.7–38.9%]; tie 55.8% [95% CI: 49.5–62.3%]; loss 12.0% [95% CI: 8.8–15.5%] | Win 14.4% [95% CI: 9.6–19.7%]; tie 65.6% [95% CI: 60.0–70.4%]; loss 20.0% [95% CI: 15.0–25.2%] |
| Prompt adherence: tie-adjusted preference | 60.1% [95% CI: 56.0–64.2%] | 47.2% [95% CI: 43.1–51.6%] |
| Responses by scale: believability / aesthetics / prompt adherence | 432 / 432 / 432 | 431 / 431 / 430 |
The whole-panel pattern favors Seedream against Qwen on all three scales. Against GPT, Seedream trails on believability and aesthetics, while the prompt-adherence interval crosses equal preference. The low agreement reported below limits each of these findings.
Does Seedream 5 Pro improve on Qwen Image 2.0?
Finding 1
Seedream 5 Pro’s believability win share against the frozen Qwen Image 2.0 outputs is 46.3% [95% CI: 41.0–51.4%], with a loss share of 25.5% [95% CI: 21.1–30.1%]. This is a directional advantage for the observed panel, whose believability agreement is low (Everypixel production team, October 2026).
Ten of the 13 evaluators gave Seedream more believability wins than losses against Qwen; three went the other way. That majority supports the aggregate direction, but it also shows why the average should not be read as agreement among all reviewers.
Does GPT Image 2 retain the believability lead?
Finding 2
Against GPT Image 2, Seedream 5 Pro receives 36.9% [95% CI: 31.2–42.7%] of tie-adjusted preference. The interval remains below equal preference, supporting a directional lead for the frozen GPT outputs on believability (Everypixel production team, October 2026).
Eleven evaluators gave Seedream more losses than wins against GPT, one gave it more wins, and one had equal counts. This direction appears across a broad part of the panel, even though reviewers often disagree on individual pairs.
Where is Seedream’s largest observed gain over Qwen?
Finding 3
Aesthetics gives Seedream 5 Pro its largest observed win-minus-loss gap against Qwen Image 2.0: 45.4 percentage points [95% CI: 36.6–53.7]. Agreement is still limited (AC1 0.214), so the gain is directional (Everypixel production team, October 2026).
An image can be attractive without being the more convincing photograph. Keeping these scales separate reveals that distinction: the aesthetic margin over Qwen is larger than the believability margin, while GPT still leads the aesthetic comparison in this sample. The study did not experimentally isolate the reasons for those preferences.
Does Seedream follow the prompt as well as GPT Image 2?
Finding 4
Seedream 5 Pro’s tie-adjusted prompt-adherence share against GPT Image 2 is 47.2% [95% CI: 43.1–51.6%]. This directional estimate does not separate the two conditions; it also does not establish equivalence (Everypixel production team, October 2026).
Prompt adherence produces many ties. An interval crossing equal preference means this test cannot resolve the difference on that measure. It does not prove that the models follow every kind of instruction equally well, particularly under untested settings or different prompt lengths.
Do art directors and QA testers see the same advantage?
Finding 5
Against Qwen Image 2.0, art directors give Seedream 5 Pro 53.8% [95% CI: 47.3–60.4%] of tie-adjusted believability preference, while QA testers give it 71.8% [95% CI: 64.9–78.7%]. The exploratory art-direction interval includes equal preference (Everypixel production team, October 2026).
This is the strongest qualification to the Qwen headline. An art director could reasonably see less improvement than the overall table suggests.
We did not compute an interval for the difference between roles, so this contrast is descriptive, not a tested difference. Roles received different assigned pairs, and this was not an experiment on professional background; the contrast does not establish why the groups differ.
Agreement is 0.132 for believability, 0.214 for aesthetics and 0.342 for prompt adherence. None supports treating the aggregate answer as a shared professional standard. These are directional findings from one production panel.
Can we publish a Seedream 5 Pro ladder index?
Ladder index status: low. The accepted card builder withholds the public headline index because its raw interval half-width is above the publication limit.
The corrected 95% interval is 73.03–93.24 ladder points, with a half-width of 10.1053; the limit is 10. The decision uses the unrounded width. Being close to the threshold does not change the status, and the article therefore releases no headline index.
The card uses the accepted joint calculation, method D, with 10,000 bootstrap draws. Every draw resamples the same scenes in the baseline and in this session, refits the calibration, and applies the small-category correction around the bootstrap mean. Ties count as half a win in the Bradley–Terry fit, which converts pairwise preferences into relative model strength.
The correction is approximate; nominal coverage has not been established. Its scope remains eight fixed categories, the observed 13-rater panel and 144 recorded Seedream outputs.
A ladder position would describe a normalized scale, not a percentage or a quality grade. This session provides no direct test of photographic equivalence.
Which categories change the pattern? (directional)
| Category | vs Qwen Image 2.0: W / T / L | vs GPT Image 2: W / T / L |
|---|---|---|
| Fashion and beauty | 14 / 22 / 18 | 7 / 14 / 33 |
| Food and Beverage | 28 / 6 / 20 | 9 / 11 / 34 |
| Interior | 26 / 16 / 12 | 17 / 24 / 13 |
| Layout & Typography | 29 / 17 / 8 | 4 / 19 / 30 |
| People and Lifestyle | 32 / 18 / 4 | 17 / 16 / 21 |
| Product and E-commerce | 21 / 18 / 15 | 12 / 19 / 23 |
| Social Marketing | 26 / 14 / 14 | 11 / 15 / 28 |
| Street and Architecture | 24 / 11 / 19 | 14 / 18 / 22 |
Fashion is the exception to Seedream’s overall lead over Qwen: it records 14 wins and 18 losses there. Interiors are the exception to its deficit against GPT, with 17 wins and 13 losses. These are six-scene subsets, so neither reversal supports a general rule about which model to route a category to.
People and lifestyle has the largest observed believability margin over Qwen. Layout and typography looks less favorable when the opponent changes to GPT. That distinction matters: an advantage over the middle anchor does not imply an advantage over the stronger anchor on the same task.
Where did Seedream 5 Pro fail, and where did it win?
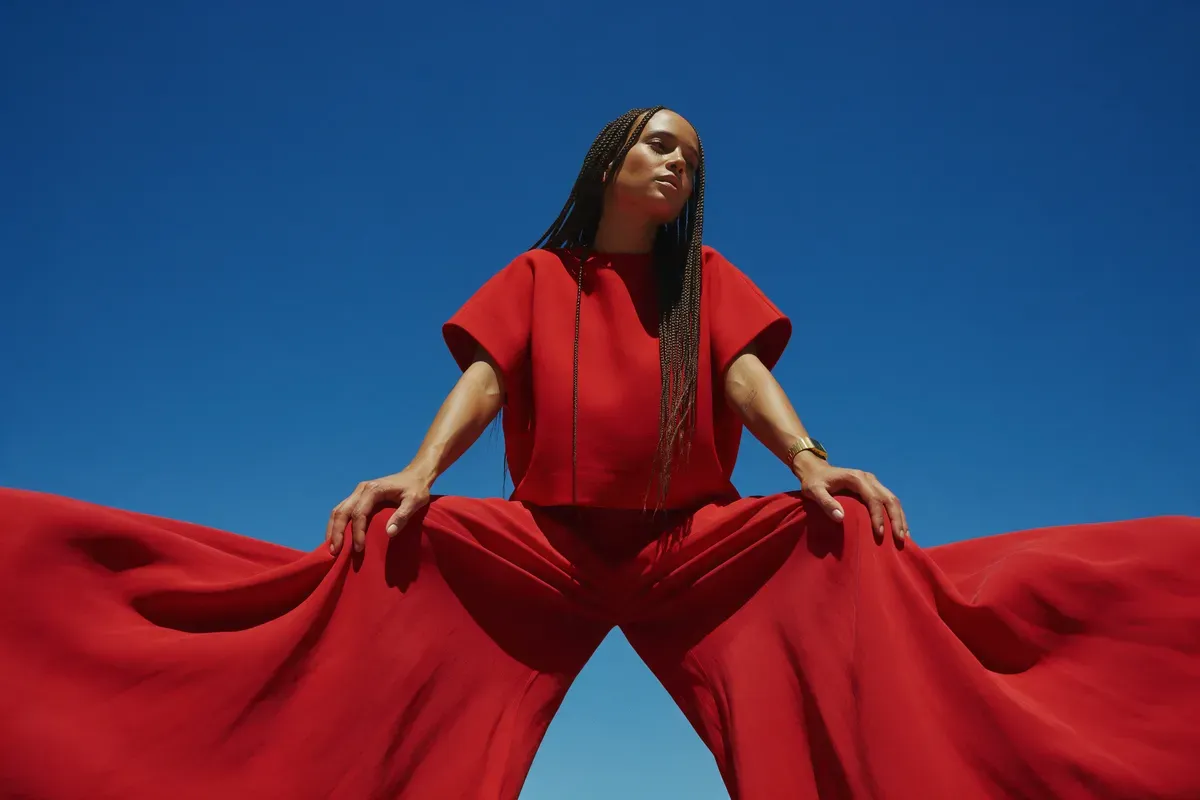
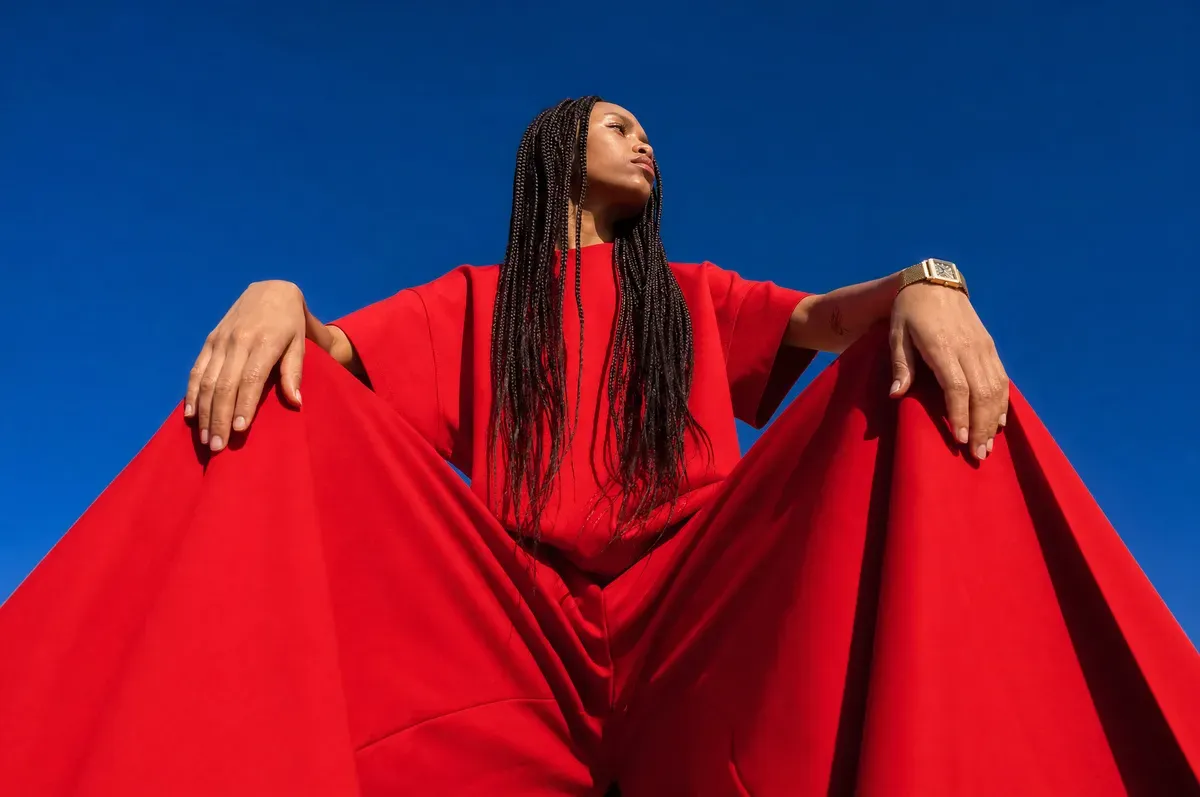
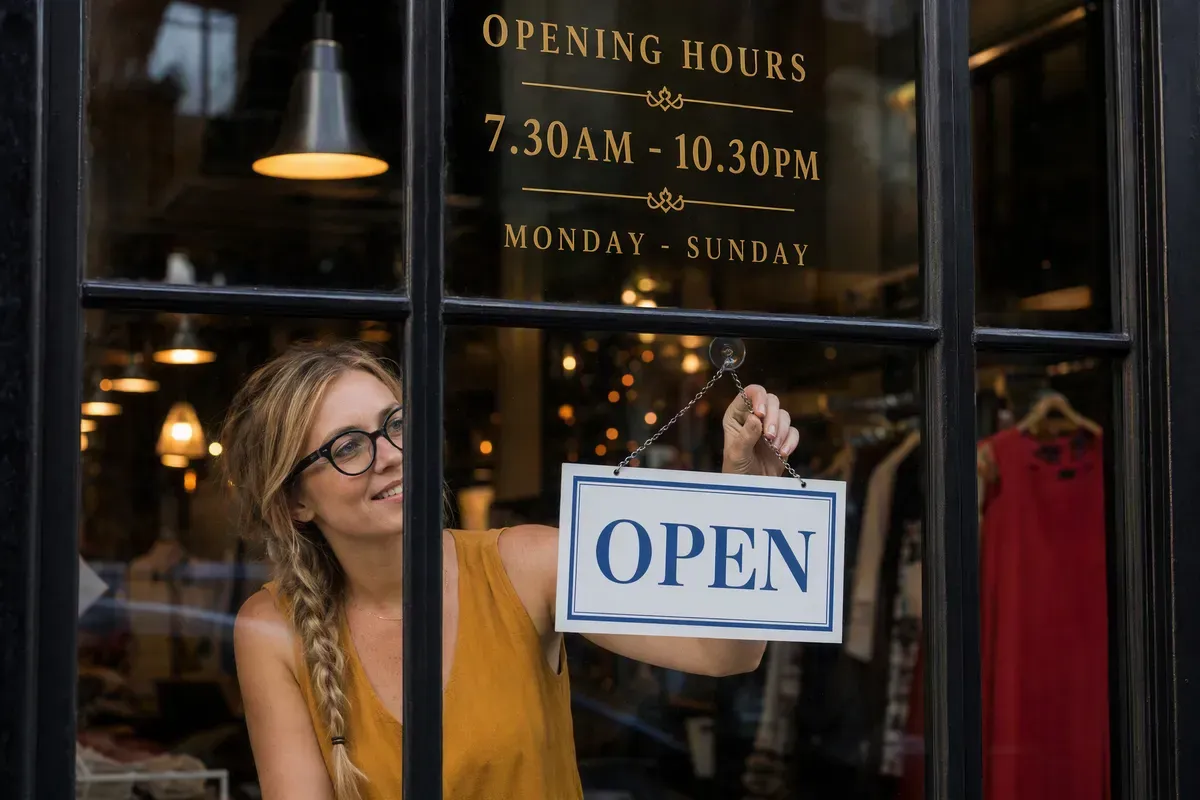
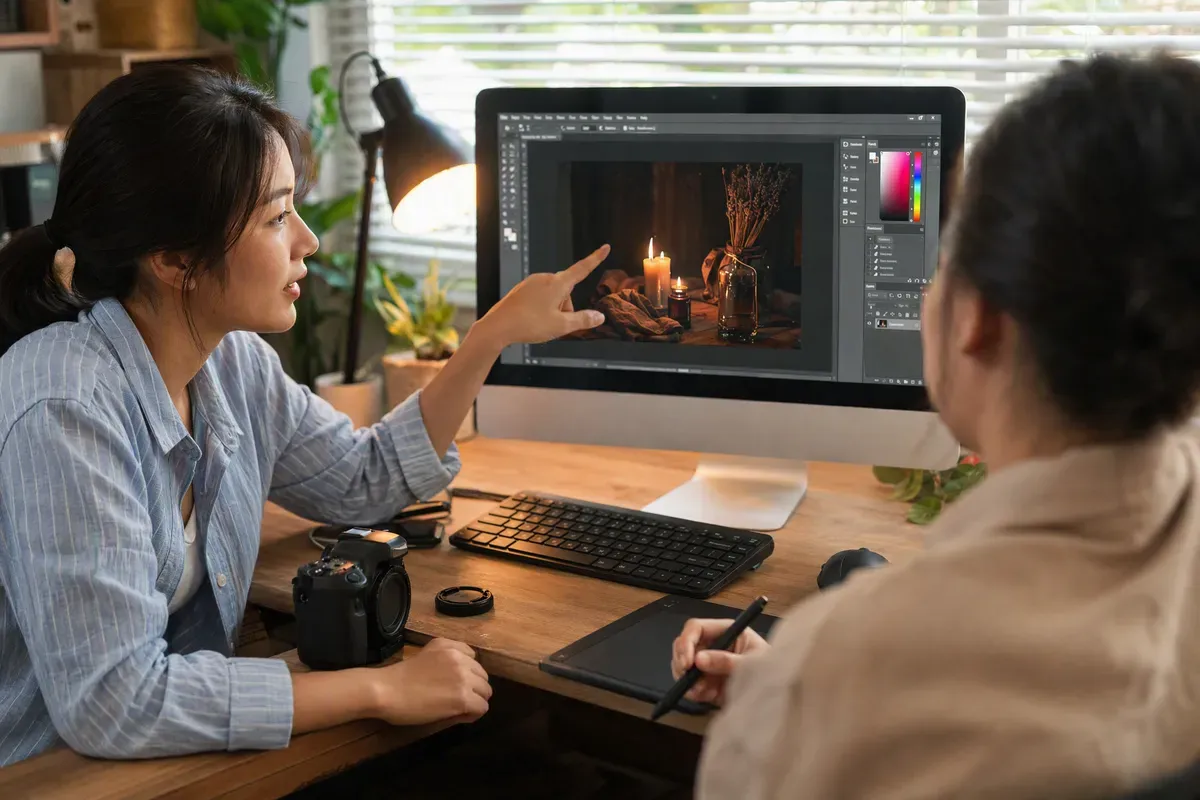
We selected these scenes by the votes before inspecting the images. Counts pool all three Seedream generations against one frozen anchor image; the illustration shows generation 1, not a hand-picked replacement. The votes identify a preference, but do not identify its visual cause.
Seedream 5 Pro
GPT Image 2
fashion_and_beauty_05
Seedream 5 Pro
GPT Image 2
layout_typography_06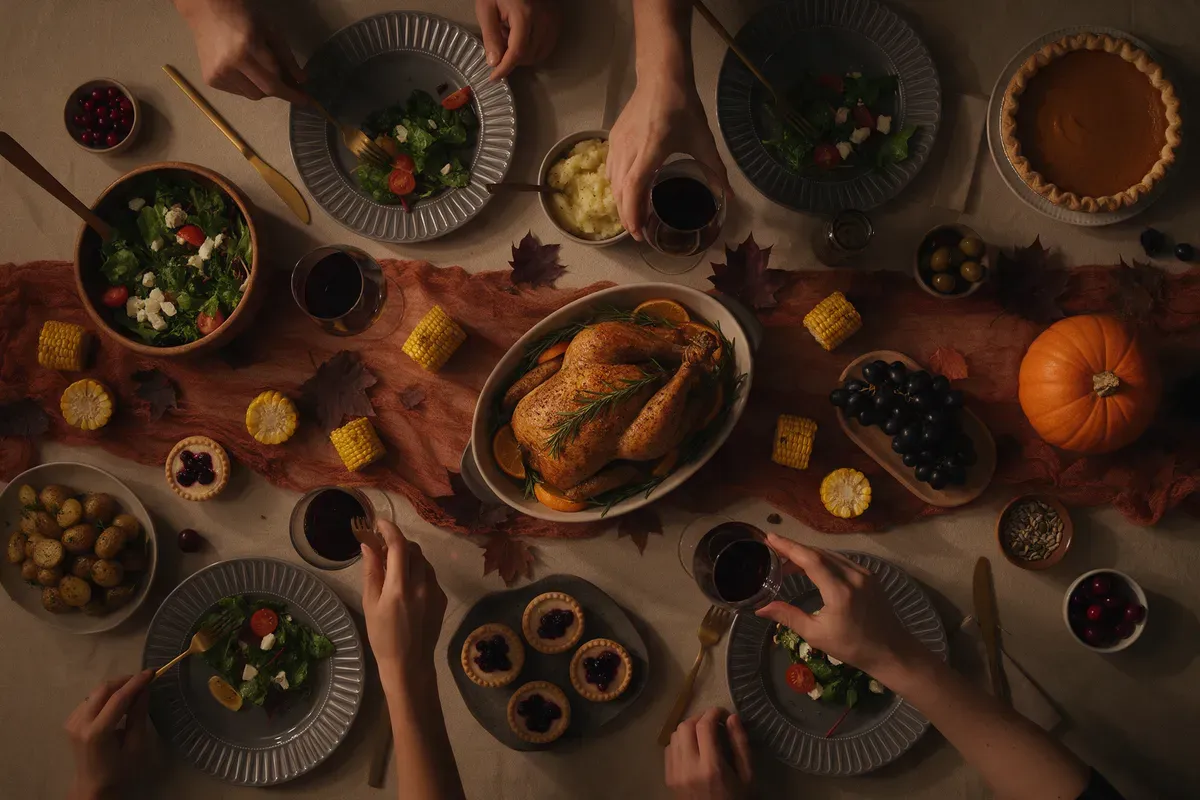
Seedream 5 Pro

Qwen Image 2.0
food_and_beverage_04
Seedream 5 Pro
GPT Image 2
people_and_lifestyle_05The low-angle fashion portrait is Seedream’s clearest loss to GPT, with all nine judgments favoring the anchor. The shop-window sign is another strong GPT result.
Against Qwen, the overhead holiday dinner is a clear local failure despite Seedream’s overall advantage. Conversely, the home-office collaboration scene favors Seedream strongly over GPT, so GPT’s aggregate lead does not cover every scene.
What is the case for Seedream 5 Pro despite GPT’s lead?
Finding 6
Seedream 5 Pro wins or ties 52.7% [95% CI: 45.8–59.7%] of believability judgments against GPT Image 2. That directional non-loss share is the strongest aggregate case for keeping Seedream in a selection workflow, although a tie is not a win (Everypixel production team, October 2026).
A team that can inspect several candidates may value a model that sometimes gives the preferred result, even when it loses the average comparison. Our examples show such cases. They do not measure how many attempts, how much review time, or what total cost would be required to deliver an accepted image.
What do the results suggest for Seedream 5 Pro tasks?
| Task | What this test suggests | Basis |
|---|---|---|
| Replacing the tested Qwen outputs | A candidate for further production trials, especially when aesthetics matters | Whole-panel advantage on all three scales; smaller, unresolved art-direction preference on believability. |
| Replacing the tested GPT outputs | The evidence does not support a general replacement | GPT leads believability and aesthetics; low agreement and scene-specific Seedream wins remain. |
| Literal prompt execution | Inspect the actual output rather than assuming one model leads | The Seedream–GPT prompt-adherence interval includes equal preference. |
| People, interiors, fashion or typography | Use the scene results to design a larger category test | Only six scenes per category; different patterns against each anchor. |
| Workflows with human selection | Retain the strongest scene examples as candidates for validation | Seedream wins particular demanding scenes, but acceptance yield and editing effort were not measured. |
What did this Seedream 5 Pro test leave out?
- Fresh repeated generations from Qwen Image 2.0 or GPT Image 2, or a symmetric estimate of generation variance.
- A direct test against Seedream 4.0, Qwen Image 2.0 Pro, GPT Image 2.5 Sunburst or real photography.
- Production acceptance rates, time to an approved asset, downstream retouching cost, licensing suitability, or a controlled speed and price comparison.
- Other Seedream endpoints, fast prompt optimization, lower resolutions, image editing or a broader set of prompt styles.
- Generalization to new professional panels, new categories, or a reliable category-specific ranking.
A stronger next study would generate repeated outputs from every compared model on documented endpoints, then test fresh scenes. The planned corpus expansion can address scene coverage, but it has not contributed any votes to this article. Until those results exist, the present dataset remains a dated comparison with fixed anchors.
Frequently asked questions
Is Seedream 5 Pro better than GPT Image 2?
Not on believability in this test: Seedream wins 21.1% [95% CI: 15.8–26.5%] and loses 47.3% [95% CI: 40.3–54.2%]. This is directional evidence from a fixed professional panel and frozen GPT outputs, not a universal model ranking.
Is Seedream 5 Pro better than Qwen Image 2.0?
The overall panel favors Seedream: tie-adjusted believability preference is 60.4% [95% CI: 56.0–64.8%]. Art directors do not clearly separate them, and the category and role findings remain exploratory.
Did Seedream 5 Pro and GPT Image 2 follow prompts equally well?
The test does not resolve a difference: Seedream’s tie-adjusted share is 47.2% [95% CI: 43.1–51.6%]. That interval includes equal preference but is not an equivalence test.
Why is there no published Seedream ladder score?
The current production card marks its interval low confidence because the unrounded half-width exceeds the publication limit. We retain the technical calculation in the dataset and withhold the public headline index.
Was this a Seedream 5 Pro vs Seedream 4.0 test?
No. The comparison images were frozen Qwen Image 2.0 and GPT Image 2 anchors. Earlier model studies share the corpus, but their separate results do not establish a direct Seedream version-to-version improvement.
Can these Seedream images be regenerated exactly?
The endpoint did not expose a seed. The archive preserves the evaluated images and recorded inputs; exact regeneration from those inputs was not demonstrated.
About Everypixel and this test
Everypixel runs a platform where production teams generate, select and license AI visuals, and research.everypixel.com publishes the team’s structured model evaluations. The raters are members of the Everypixel production team who work on stock, advertising and editorial content. Of the 48 reference photographs behind the ladder prompts, 38 come from Everypixel’s own production and 10 from Unsplash.
Disclosure: Everypixel conducted this evaluation and paid for all of its compute; no vendor funded it. Everypixel plans to offer all three tested models on its platform, so it has a commercial interest in each of them.
If you are a vendor or reader and find an error, write to hello@everypixel.com.
Sources
- Seedream V5.0 Pro model endpointwavespeed.ai/models/bytedance/seedream-v5.0-pro
External source accessed October 13, 2026. Internal benchmark data and the accepted ladder calculation are listed below.
Data
Canonical results JSON · Anonymized votes CSV · Summary CSV · Prompt pack CSV
The evaluated image archive contains 144 Seedream images and 96 frozen anchor images. The data package includes exact pair-to-generation mappings and image hashes. Raters are anonymized; employee names and private billing records are excluded.
Tabular data is licensed CC BY 4.0. The image archive is supplied for benchmark inspection; the data license does not grant a blanket reuse license to the images.
Check the applicable provider and model terms before reusing generated outputs. The reference photographs are not included.
Suggested citation: Everypixel production team. Seedream 5 Pro vs GPT Image 2: a 48-scene blind test. Evaluation September 30–October 13, 2026; data revision October 13, 2026. Session 70869064-b007-4442-a6b2-a8364e416850.
Cite this article
<blockquote cite="https://research.everypixel.com/seedream-5-pro-vs-gpt-image-2/"> <p>In a blind test by 13 production professionals, Seedream 5 Pro led the frozen Qwen Image 2.0 outputs but trailed GPT Image 2 on believability. Agreement was low; prompt adherence did not separate Seedream from GPT.</p> <footer>— <a href="https://research.everypixel.com/seedream-5-pro-vs-gpt-image-2/">Is Seedream 5 Pro Better Than GPT Image 2? A 48-Scene Blind Test</a>, Everypixel Research, October 2026</footer> </blockquote>
Everypixel Research. (2026). Is Seedream 5 Pro Better Than GPT Image 2? A 48-Scene Blind Test. research.everypixel.com. https://research.everypixel.com/seedream-5-pro-vs-gpt-image-2/